Oun Al-iedani1,2, Saadallah Ramadan2,3, Karen Ribbons2, Rodney Lea2, and Jeannette Lechner-Scott2,4,5
1School of Health Sciences, University of Newcastle, Newcastle, Australia, 2Hunter Medical Research Institute, Newcastle, Australia, 3Faculty of Health and Medicine, University of Newcastle, Newcastle, Australia, 4Department of Neurology, John Hunter Hospital, Newcastle, Australia, 5School of Medicine and Public Health, University of Newcastle, Newcastle, Australia
1School of Health Sciences, University of Newcastle, Newcastle, Australia, 2Hunter Medical Research Institute, Newcastle, Australia, 3Faculty of Health and Medicine, University of Newcastle, Newcastle, Australia, 4Department of Neurology, John Hunter Hospital, Newcastle, Australia, 5School of Medicine and Public Health, University of Newcastle, Newcastle, Australia
Clinical parameters, MR-volumetrics and neurometabolic concentrations showed no statistically significant differences between fingolimod and injectable cohorts. MRI metrics and neurometabolites from PCG and PFC, showed moderate correlations with cognition, fatigue and memory.
Figure
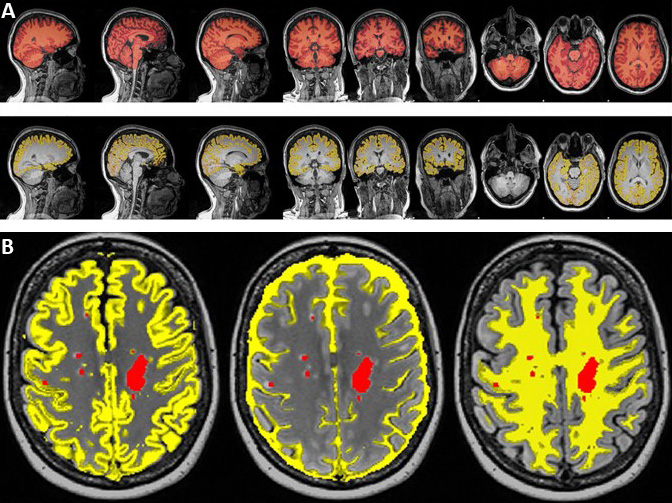
2. (A):Brain tissue volume, normalised for subject head size, was estimated
with SIENAX. Final SIENAX segmentation results of whole brain (top row) and
peripheral cortex masked segmentation (bottom row).
(B):Partial volume segmentation of
the MS lesions using T2-FLAIR and filled T1-MPRAGE structural image was
segmented using FSLFAST.
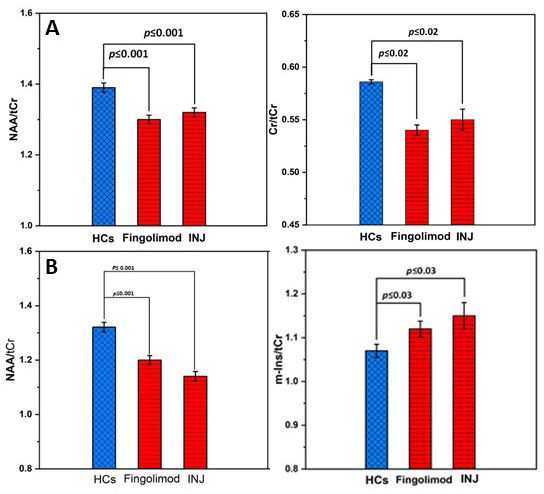
Figure 3. (A)PCG neurometabolite/tCr
ratio (tNAA and Glx) in HCs and RRMS fingolimod and injectables (INJ:
GA+interferon) disease modifying therapies.
(B) PFC neurometabolite/tCr
ratio (NAA and m-Ins) in HCs and RRMS fingolimod and injectable (INJ:
GA+interferon) DMTs.