Paola Valsasina1, Milagros Hidalgo de la Cruz1, Alessandro Meani1, Claudio Gobbi2,3, Antonio Gallo4, Chiara Zecca2,3, Alvino Bisecco4, Maria A. Rocca1,5,6, and Massimo Filippi1,5,6,7,8
1Neuroimaging Research Unit, Division of Neuroscience, IRCCS San Raffaele Scientific Institute, Milan, Italy, 2Multiple Sclerosis Center, Department of Neurology, Neurocenter of Southern Switzerland, Civic Hospital, Lugano, Switzerland, 3Faculty of Biomedical Sciences, Università della Svizzera Italiana, Lugano, Switzerland, 4Department of Advanced Medical and Surgical Sciences, and 3T MRI Center, University of Campania “Luigi Vanvitelli”, Naples, Italy, 5Neurology Unit, IRCCS San Raffaele Scientific Institute, Milan, Italy, 6Vita-Salute San Raffaele University, Milan, Italy, 7Neurorehabilitation Unit, IRCCS San Raffaele Scientific Institute, Milan, Italy, 8Neurophysiology Service, IRCCS San Raffaele Scientific Institute, Milan, Italy
1Neuroimaging Research Unit, Division of Neuroscience, IRCCS San Raffaele Scientific Institute, Milan, Italy, 2Multiple Sclerosis Center, Department of Neurology, Neurocenter of Southern Switzerland, Civic Hospital, Lugano, Switzerland, 3Faculty of Biomedical Sciences, Università della Svizzera Italiana, Lugano, Switzerland, 4Department of Advanced Medical and Surgical Sciences, and 3T MRI Center, University of Campania “Luigi Vanvitelli”, Naples, Italy, 5Neurology Unit, IRCCS San Raffaele Scientific Institute, Milan, Italy, 6Vita-Salute San Raffaele University, Milan, Italy, 7Neurorehabilitation Unit, IRCCS San Raffaele Scientific Institute, Milan, Italy, 8Neurophysiology Service, IRCCS San Raffaele Scientific Institute, Milan, Italy
In multiple sclerosis, random forest identified brain lesion volume, grey
matter and thalamic atrophy as the main determinants of low clinical disability
(EDSS=3.0 and 4.0), while cervical cord damage was the major contributor to
EDSS=6.0.
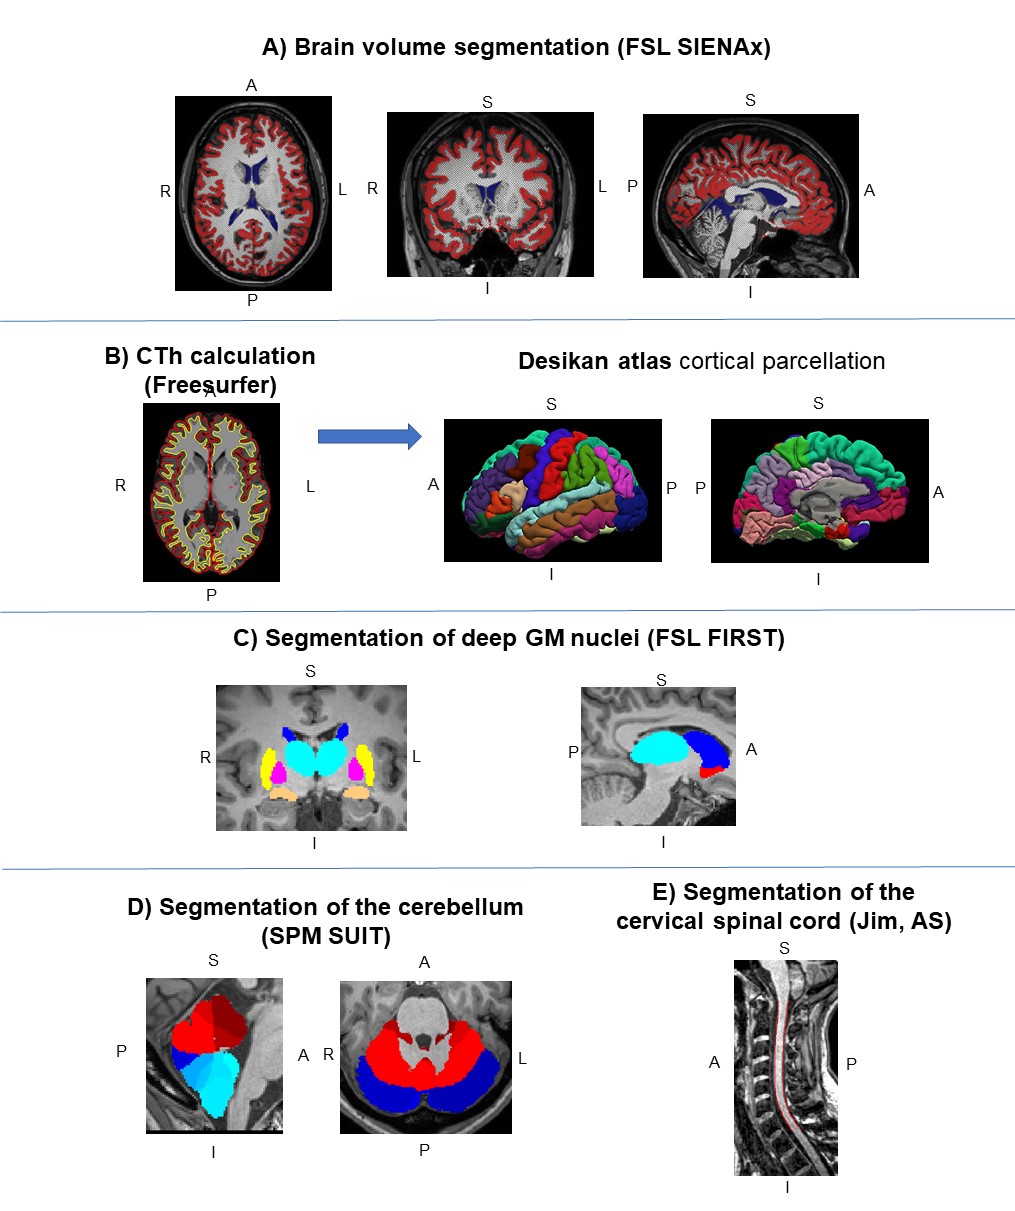
Figure
1.
Calculation of the different CNS compartments in a study subject. A) Global
brain volumetry (FSL SIENAx); B) Cortical thickness (Freesurfer) and
related cortical parcellation using Desikan atlas; C) Deep grey matter volume (FSL FIRST); D) Cerebellar volumes (SPM12 SUIT); and
E) Cervical cord segmentation (Jim software, active surface method). Each colour represents a different compartment for each
subgroup of images. Abbreviations: CTh=cortical thickness; GM=grey matter;
AS=active surface; A=anterior; P=posterior; S=superior; I=inferior; L=left;
R=right.
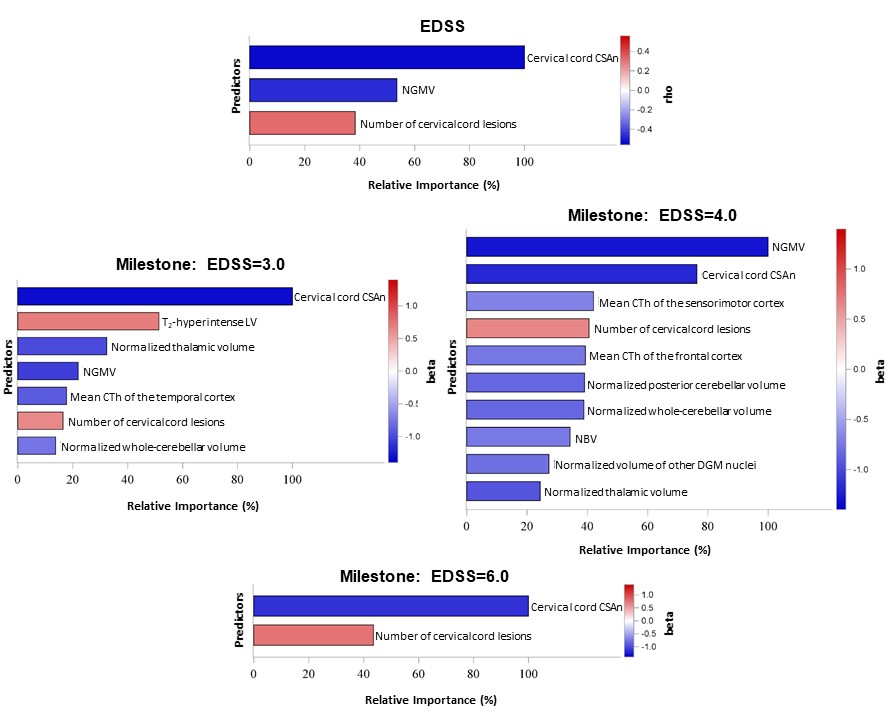
Figure
2. Bar charts showing relative importance of MRI
predictors of EDSS score, and of reaching different EDSS milestone (3.0, 4.0, 6.0),
in MS patients selected with random forest analyses (p<0.05). Colors reflect
the magnitude of Spearman’s correlation of each predictor with EDSS score. Standardized
beta coefficient from univariate logistic regression models is represented for
classification models. NGMV=normalized
grey matter volume; NBV=normalized brain volume; CTh=cortical thickness;
CSAn=normalized cross-cross sectional area; DGM=deep grey matter