Sangcheon Choi1,2, Yi Chen1, Hang Zeng1,2, and Xin Yu1,3
1Max Planck Institute for Biological Cybernetics, Tuebingen, Germany, 2Graduate Training Centre of Neuroscience, Tuebingen, Germany, 3MGH/MIT/HMS Athinoula A. Martinos Center for Biomedical Imaging, Department of Radiology, Harvard Medical School, Massachusetts General Hospital, Charlestown, MA, United States
1Max Planck Institute for Biological Cybernetics, Tuebingen, Germany, 2Graduate Training Centre of Neuroscience, Tuebingen, Germany, 3MGH/MIT/HMS Athinoula A. Martinos Center for Biomedical Imaging, Department of Radiology, Harvard Medical School, Massachusetts General Hospital, Charlestown, MA, United States
We developed a bilateral line-scanning (BiLS) fMRI method to investigate interhemispheric slow fluctuations (< 0.1 Hz) with laminar specificity in rs-fMRI in anesthetized rats. Based on the coherence analysis, two distinct slow fluctuation features in symmetric cortices were identified.
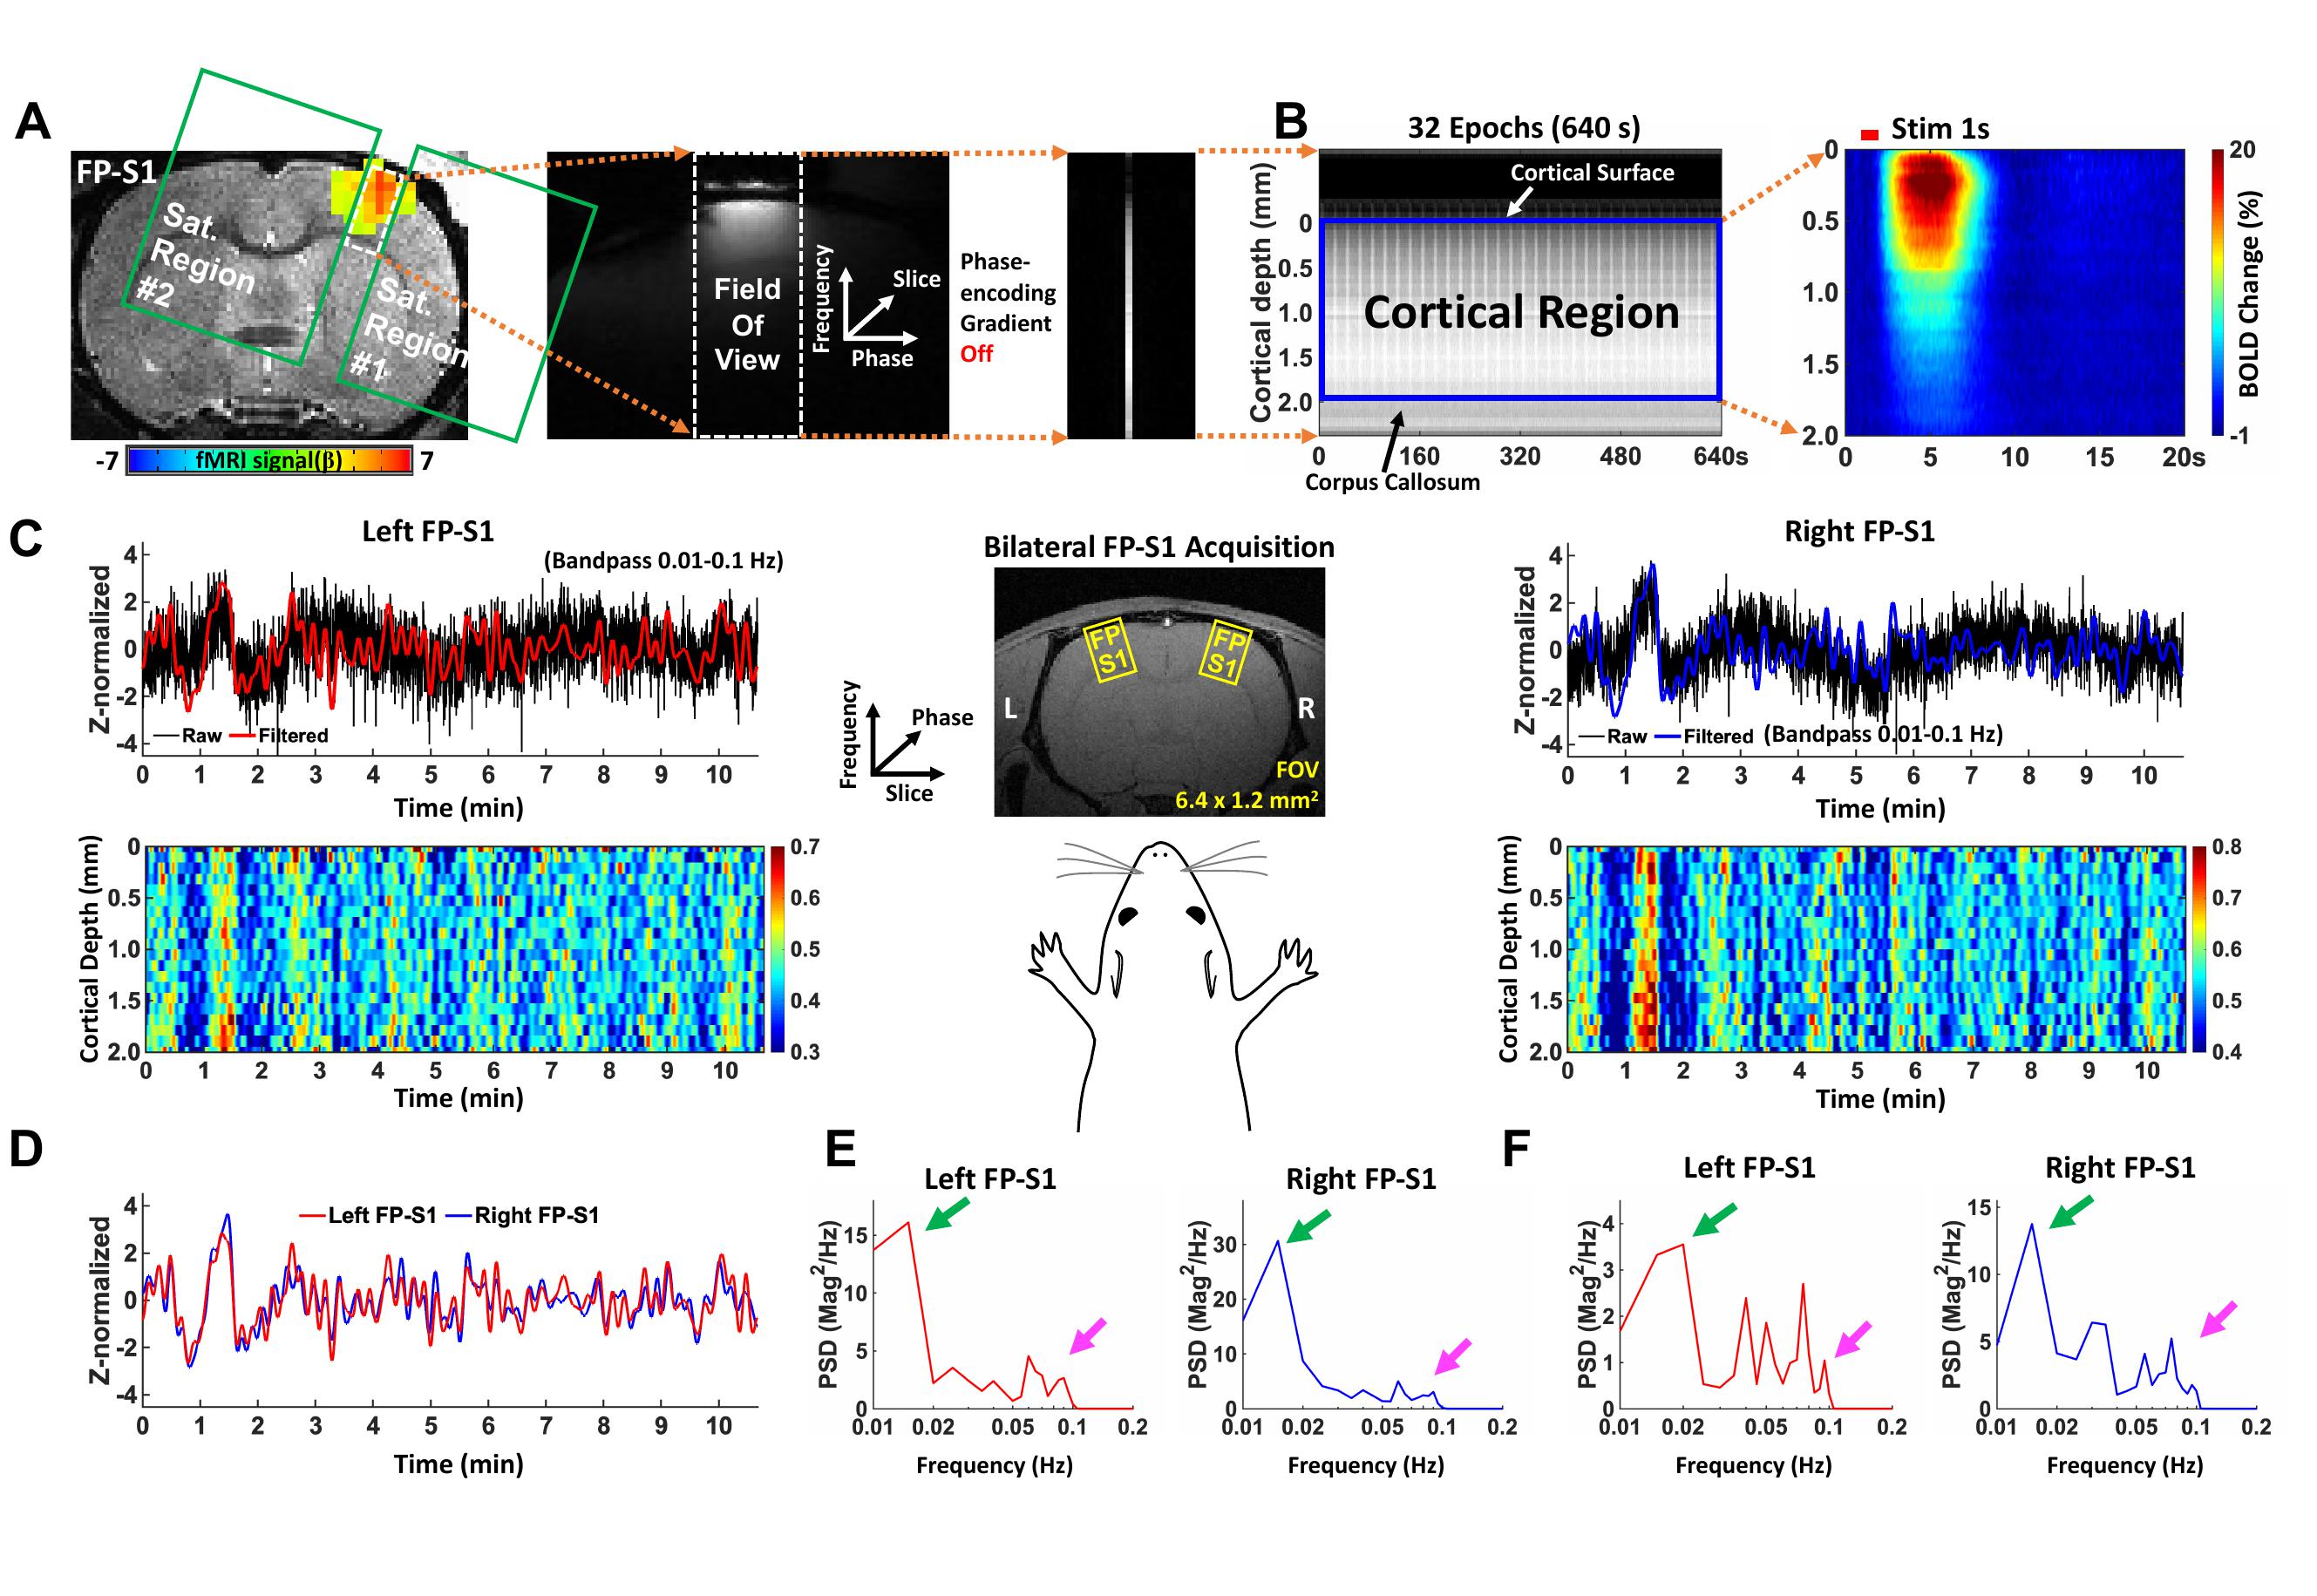
Fig. 1. BiLS acquisition in resting-state fMRI. A) Sequential signal processing of the conventional UniLS method. B) Spatiotemporal map and percentage change map in evoked fMRI using the UniLS method. C-F) resting-state BOLD responses in the symmetric FP-S1 regions using BiLS method (n = 32 trials of 4 rats). C) Top: Representative Z-normalized fMRI time series. Bottom: normalized cortical depth maps in both the FP-S1 regions from one representative trial. D-E) Comparison of the filtered time series (D) and their PSDs from the same trial (E). F) PSDs from another representative trial.
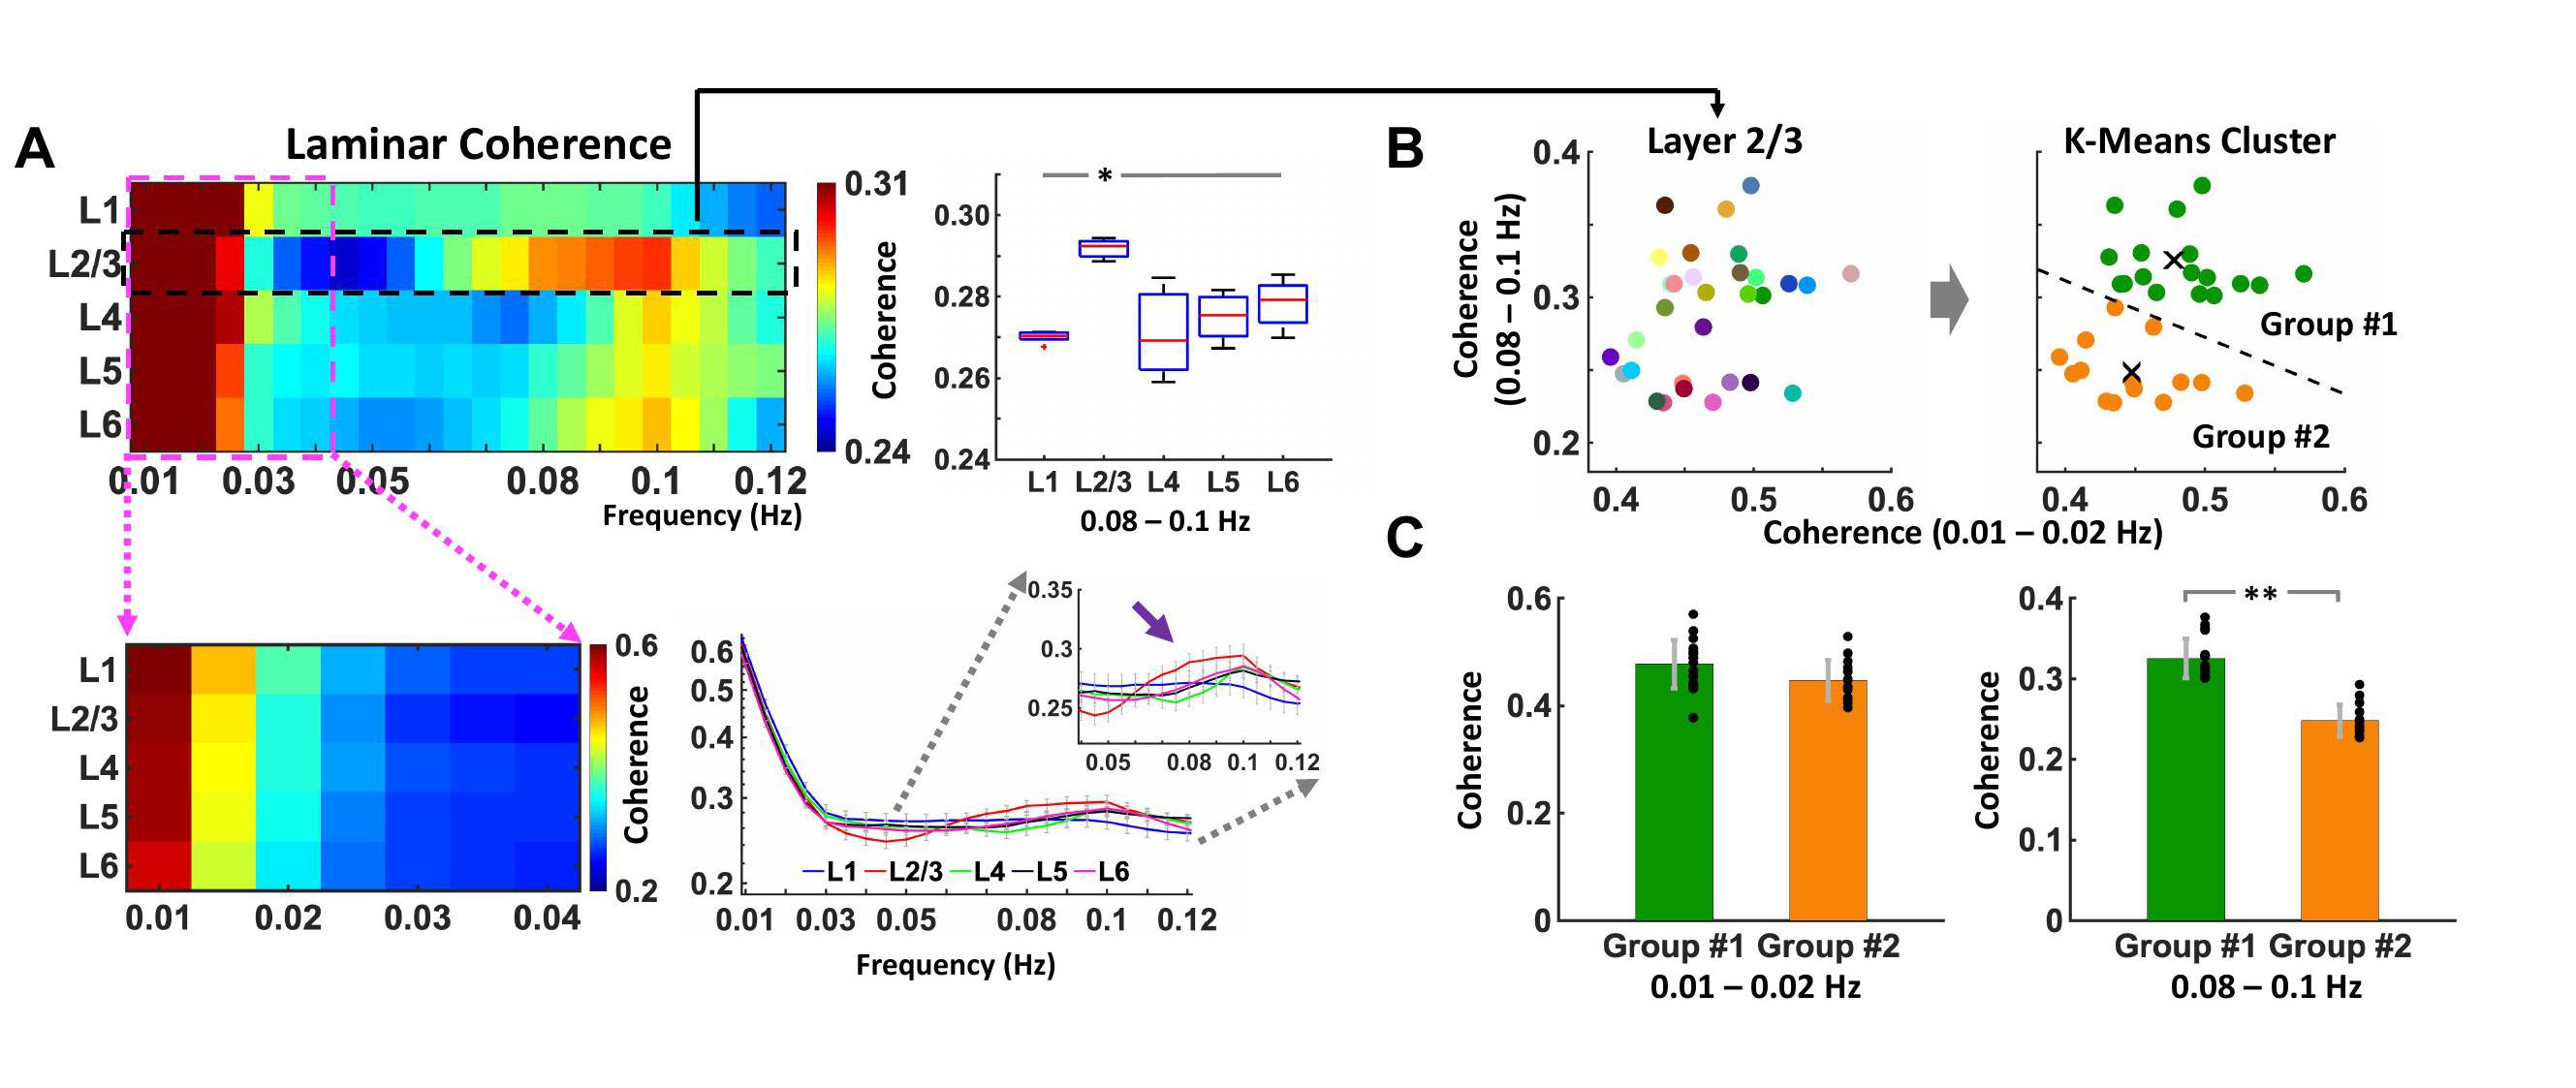
Fig. 2. Laminar-specific coherence in rs-fMRI. A) Laminar-specific coherence (n = 32 trials of 4 rats) showing that L2/3 is significantly different at 0.08-0.1 Hz (one-way ANOVA, post-hoc: *p-value <0.05, Bonferroni correction). B) K-means clustering based grouping with L2/3 specific coherence values at 0.01-0.02 Hz (x-axis) and 0.08-0.1 Hz (y-axis). C) Independent group t-test with the L2/3 coherence values from the individual groups at 0.01-0.02 Hz (left) and 0.08-0.1 Hz (right), showing significant difference at 0.08-0.1 Hz (**p-value = 1.4127*10^-10).