Benedikt Hager1,2,3, Markus M. Schreiner4, Sonja M. Walzer4, Lena Hirtler5, Vladimir Mlynarik1, Martin Zalaudek1, Andreas Berg6, Xeni Deligianni7,8, Oliver Bieri7,8, Reinhard Windhager4, Vladimir Juras1, and Siegfried Trattnig1
1Department of Biomedical Imaging and Image-guided Therapy, High Field MR Centre, Medical University of Vienna, Vienna, Austria, 2CD Laboratory for Clinical Molecular MR Imaging, Vienna, Austria, 3Austrian Cluster for Tissue Regeneration, Ludwig Boltzmann Institute for Experimental and Clinical Traumatology, Vienna, Austria, 4Department of Orthopedics and Trauma-Surgery, Medical University of Vienna, Vienna, Austria, 5Center for Anatomy and Cell Biology, Division of Anatomy, Medical University of Vienna, Vienna, Austria, 6Center for Medical Physics and Biomedical Engineering, Medical University of Vienna, Vienna, Austria, 7Division of Radiological Physics, Department of Radiology, University of Basel Hospital, Basel, Switzerland, 8Department of Biomedical Engineering, University of Basel, Allschwil, Switzerland
1Department of Biomedical Imaging and Image-guided Therapy, High Field MR Centre, Medical University of Vienna, Vienna, Austria, 2CD Laboratory for Clinical Molecular MR Imaging, Vienna, Austria, 3Austrian Cluster for Tissue Regeneration, Ludwig Boltzmann Institute for Experimental and Clinical Traumatology, Vienna, Austria, 4Department of Orthopedics and Trauma-Surgery, Medical University of Vienna, Vienna, Austria, 5Center for Anatomy and Cell Biology, Division of Anatomy, Medical University of Vienna, Vienna, Austria, 6Center for Medical Physics and Biomedical Engineering, Medical University of Vienna, Vienna, Austria, 7Division of Radiological Physics, Department of Radiology, University of Basel Hospital, Basel, Switzerland, 8Department of Biomedical Engineering, University of Basel, Allschwil, Switzerland
In this study, the orientation dependence of T2* decay and the mono- vs. bi-exponentiality of T2* decay of Achilles and patellar tendons were investigated in vitro with a variable echo time sequence and microscopic resolution, and the results were compared with histological findings.
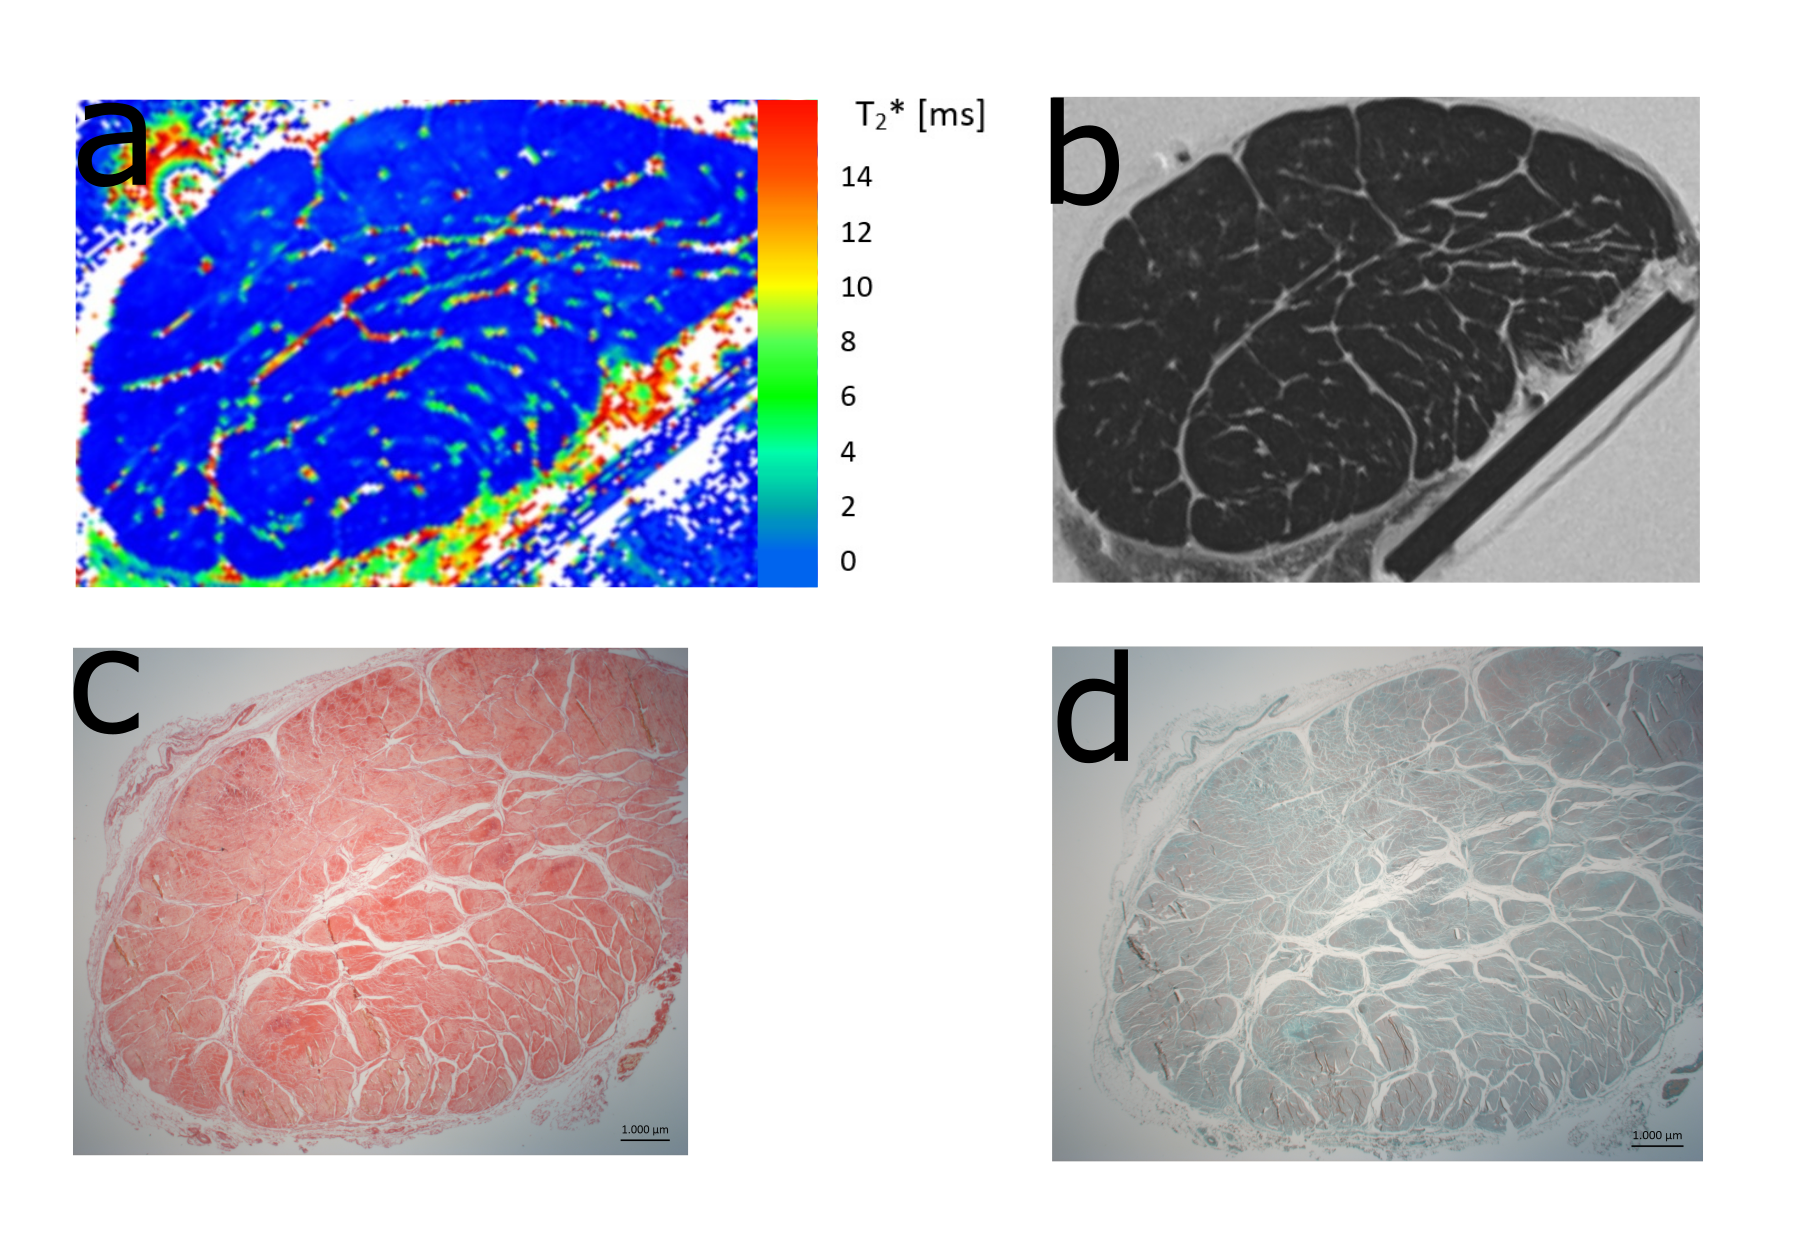
Figure 2 a) Representative T2* map of one tendon measured at 0° shows the difference between T2* values of fascicle bundles and non-fasicle connective tissue (endotendon, epitenon). This difference is also visible in a morphological T2 weighted image (TE= 6.6ms) (b).
c,d) Histological assessment was performed with Picrosirius red staining and polarized light microscopy as well as Safranin-O staining. The shape of the fiber bundles and the connective tissue between them are clearly visible.
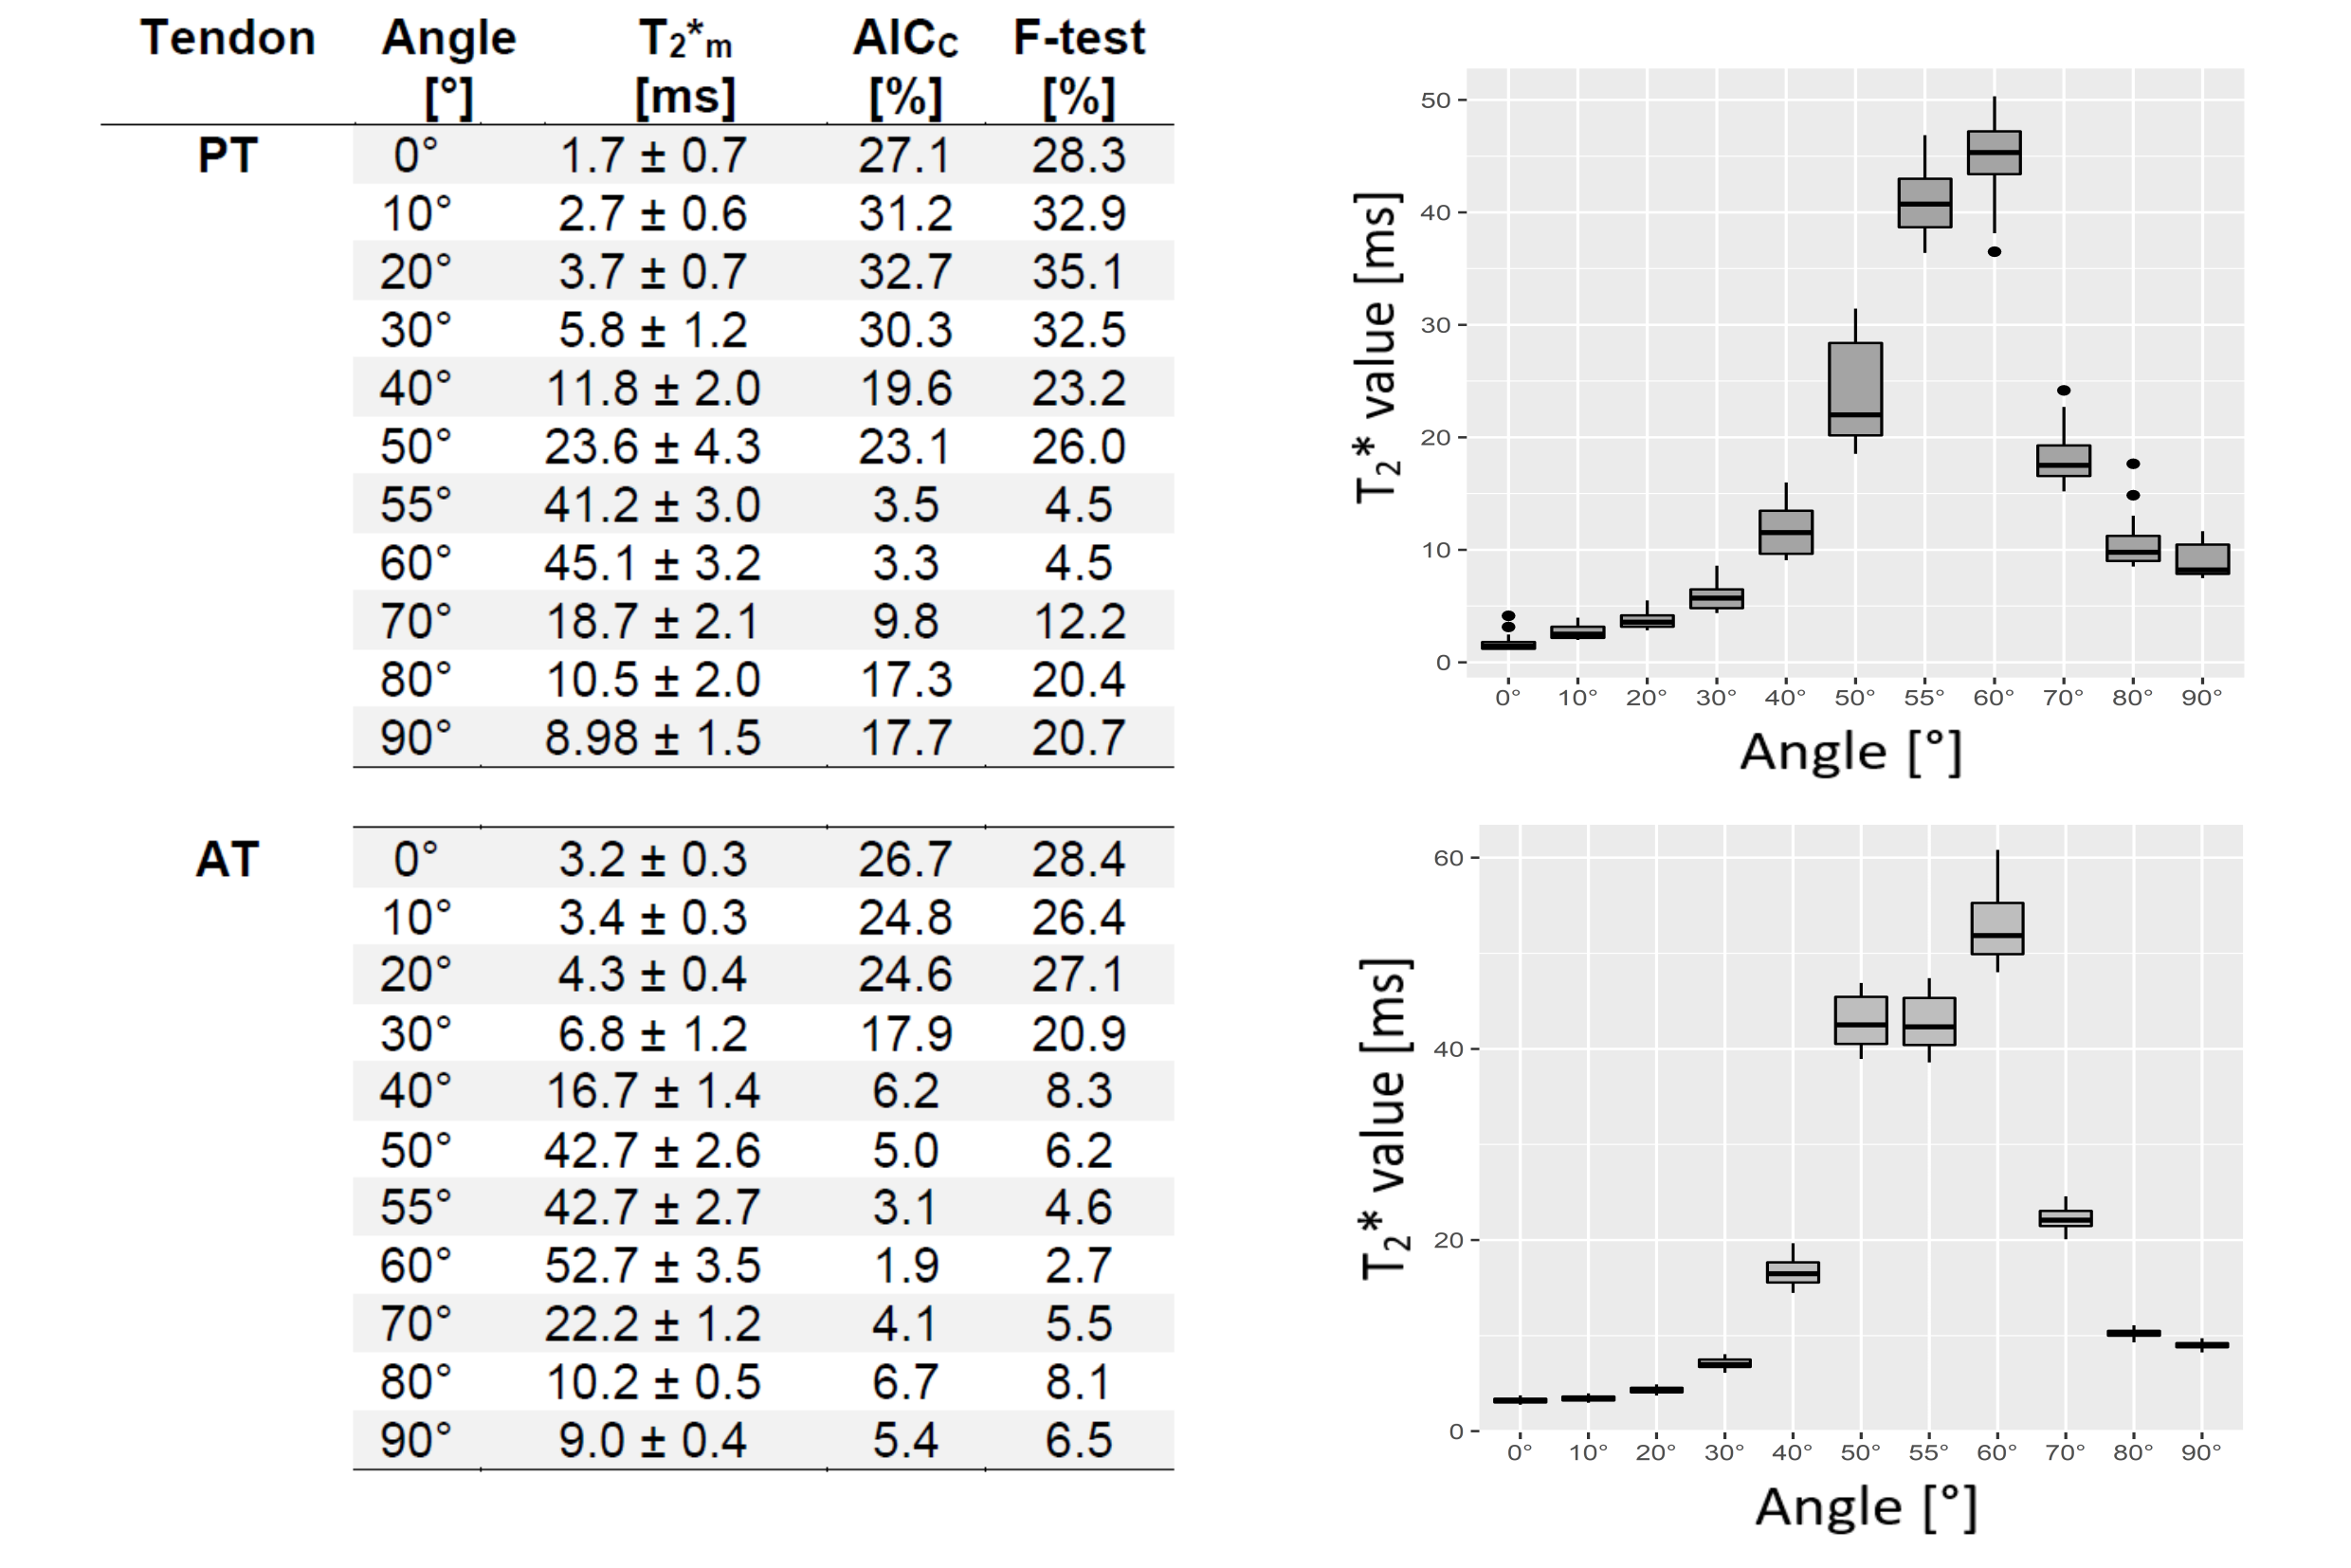
Figure 3) One Achilles and one patellar tendon each were measured at 11 fiber-to-field angles. The mean monoexponential T2* values (T2*m) from 30 consecutive slices are provided. The percentage of voxels preferentially following a bi-exponential decay (measured by AICC and F-test) is given for all voxels and orientations. Boxplots are shown on the right.