Yu Shen1, Xianchang Zhang2, Yan Bai1, Rui Zhang1, Rushi Chen1, Wei Wei1, Menghuan Zhang1, and Meiyun Wang1
1Department of Medical Imaging, Henan Provincial People’s Hospital & Zhengzhou University, Zhengzhou, China, 2MR Collaboration, Siemens Healthcare Ltd. Beijing China, Beijing, China
1Department of Medical Imaging, Henan Provincial People’s Hospital & Zhengzhou University, Zhengzhou, China, 2MR Collaboration, Siemens Healthcare Ltd. Beijing China, Beijing, China
Tract density imaging values were significantly decreased after magnetic resonance-guided focused ultrasound in the genu of the corpus callosum and left globus pallidus of seven patients with Parkinson’s disease.
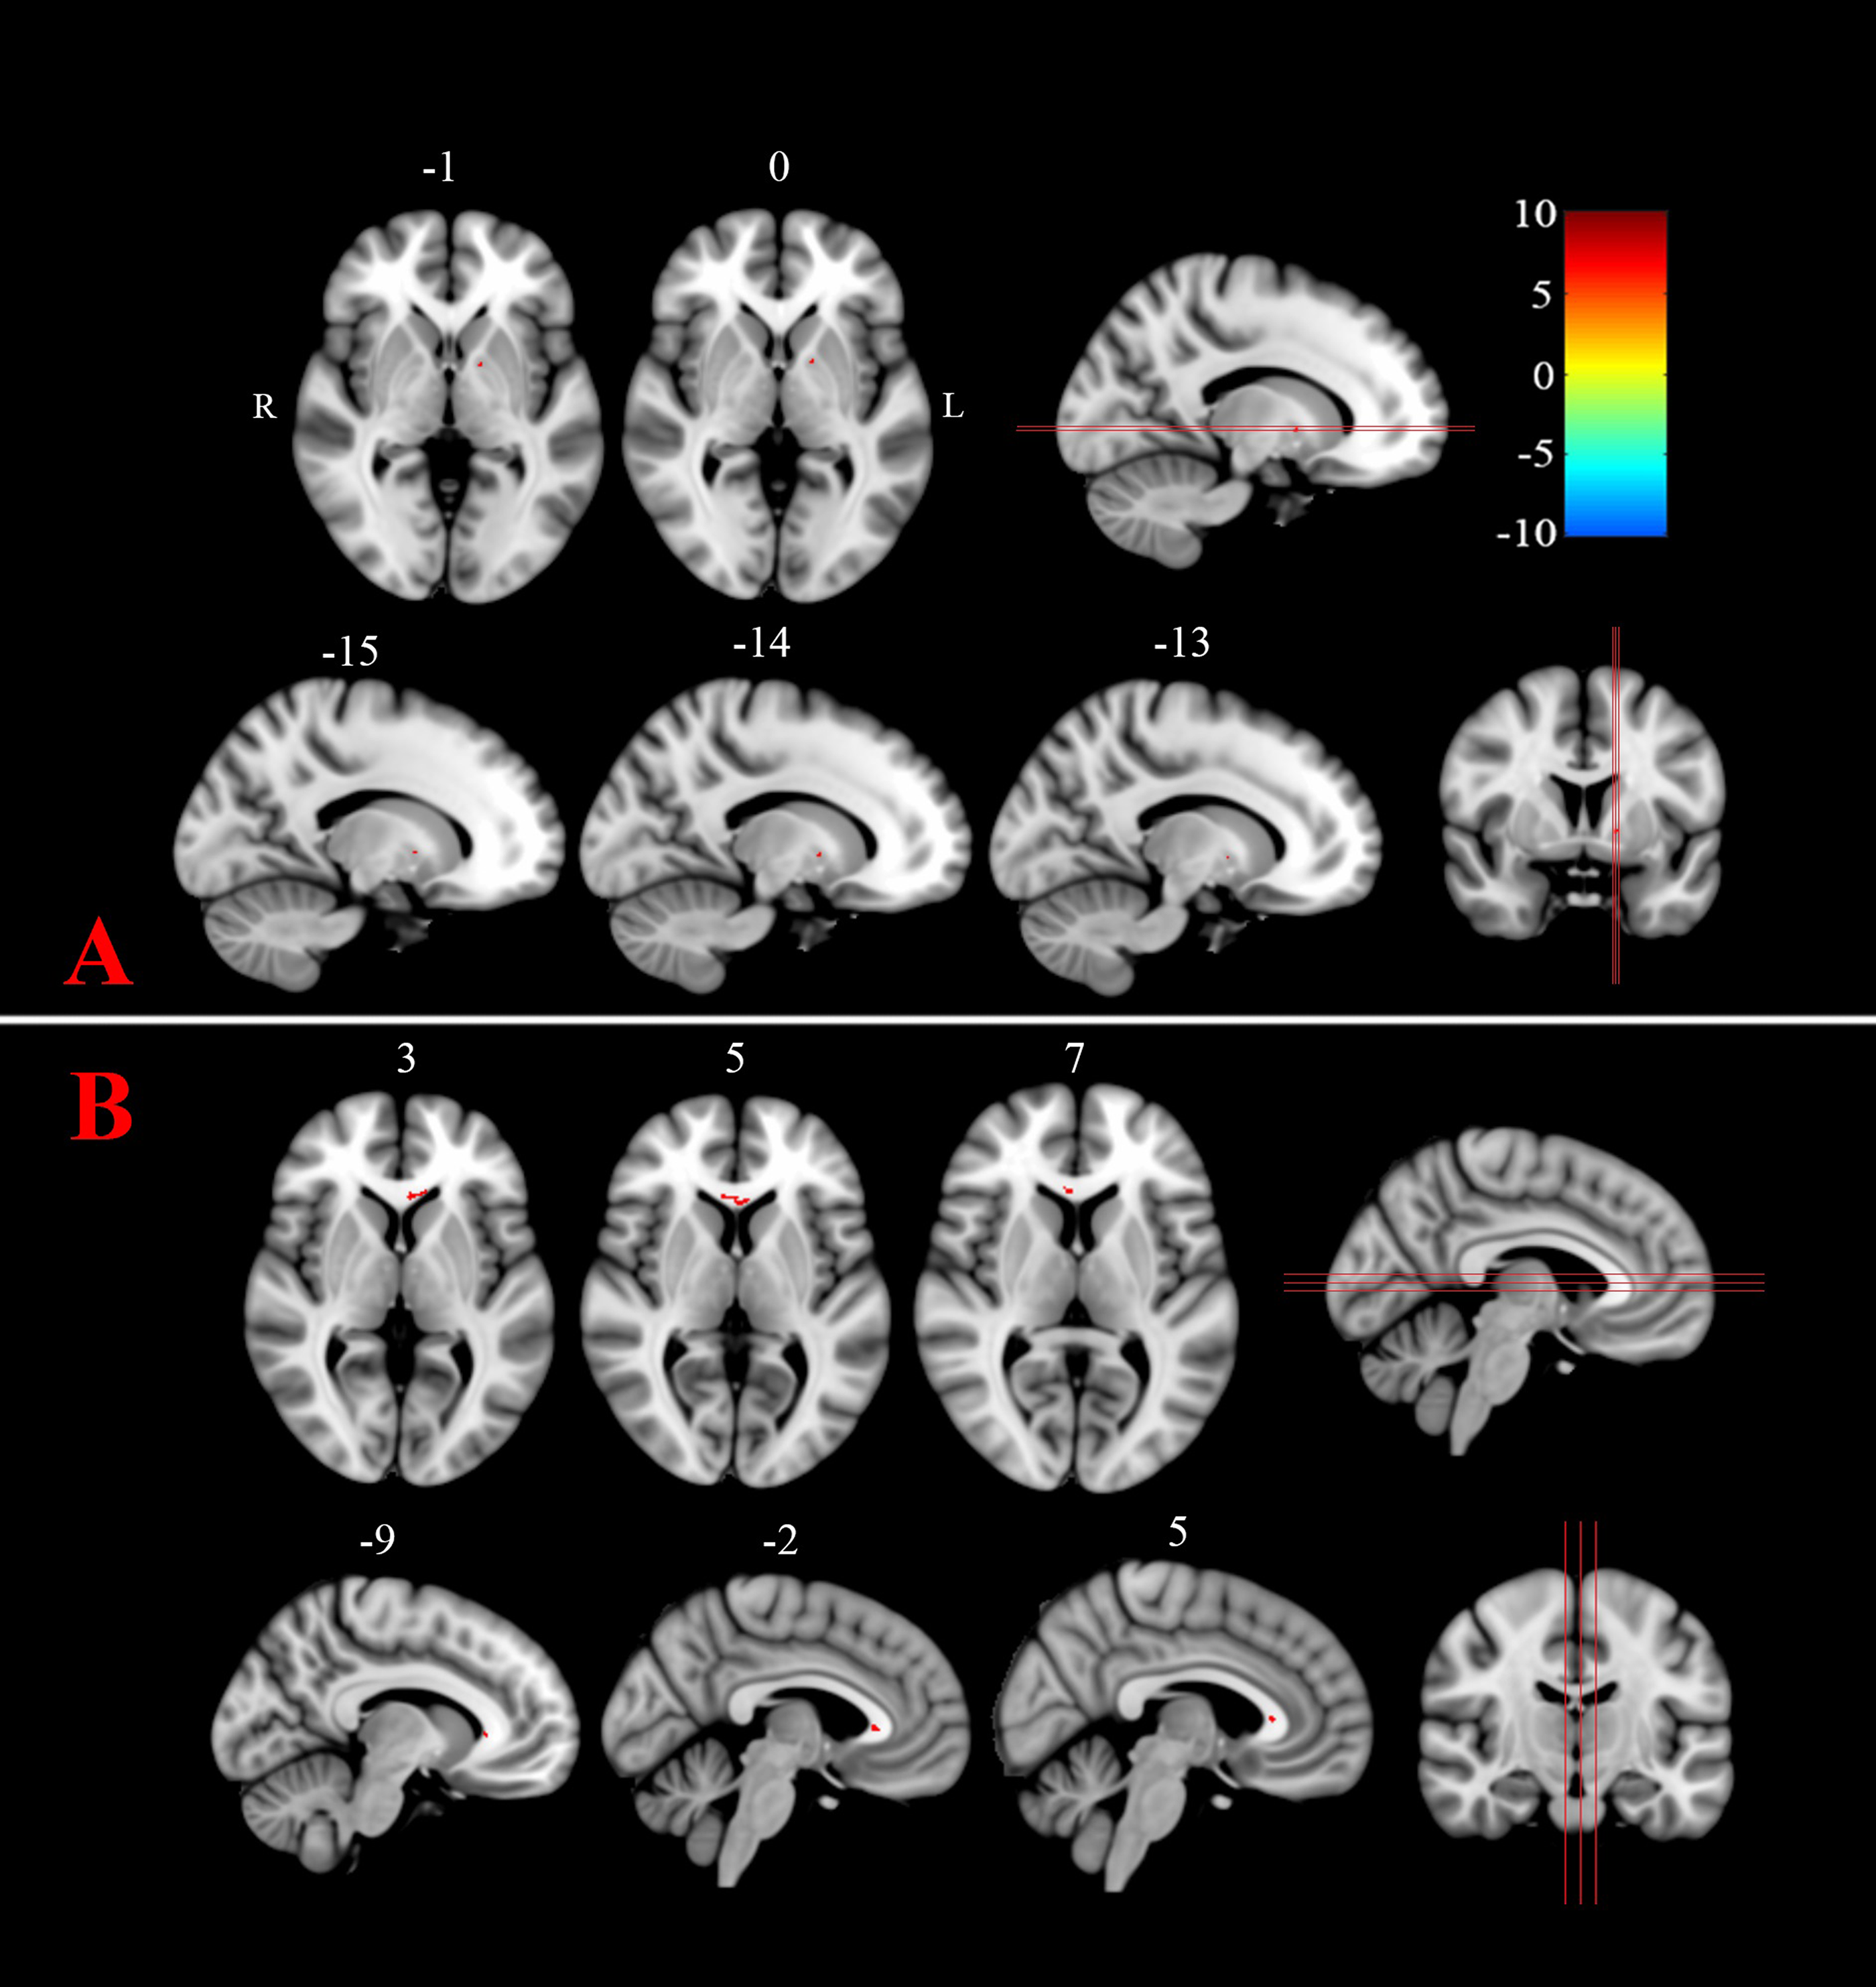
Figure 3. The brain areas with significantly decreased track density values postoperatively, overlaying on the T1 template. A) Left globus pallidus and B) genu of the corpus callosum. The color bar represents the t-value of the T-test.
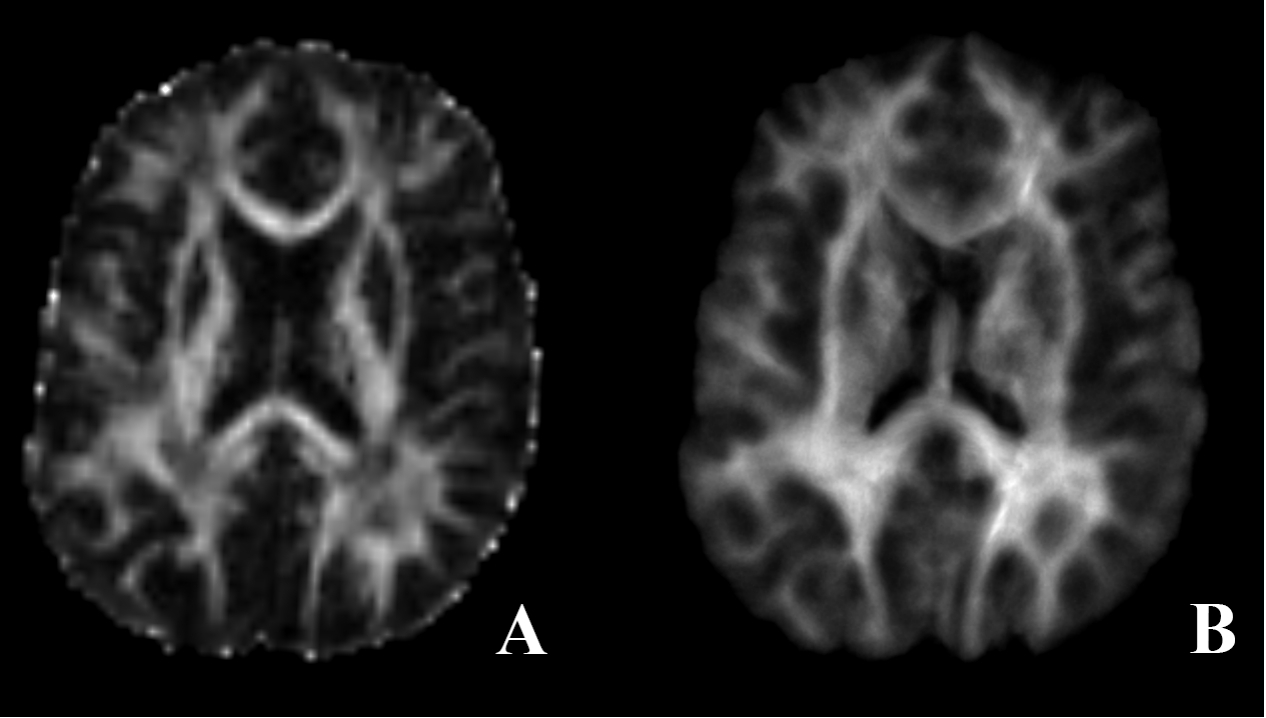
Figure 1. The A) fractional anisotropy (FA) and B) track density image (TDI) from the same patient. TDI has a higher spatial resolution than that of the FA image (1 × 1 × 1 mm3 vs 2.2 × 2.2 × 2.2 mm3, respectively).