Emma Biondetti1,2,3, Mathieu D. Santin1,2, Romain Valabrègue1,2, Graziella Mangone1,4, Rahul Gaurav1,2,3, Nadya Pyatigorskaya1,3,5, Matthew Hutchison6, Lydia Yahia-Cherif1,2, Nicolas Villain1,7, Marie-Odile Habert8, Isabelle Arnulf1,3,9, Smaranda Leu-Semenescu9, Pauline Dodet9, Jean-Christophe Corvol1,4,7, Marie Vidailhet1,3,7, and Stéphane Lehéricy1,2,3,5
1Institut du Cerveau – ICM, INSERM U 1127, CNRS UMR 7225, Sorbonne Université, Paris, France, 2ICM, Centre de NeuroImagerie de Recherche – CENIR, Paris, France, 3ICM, Team “Movement Investigations and Therapeutics” (MOV’IT), Paris, France, 4National Institute of Health and Medical Research - INSERM, Clinical Investigation Centre, Pitié-Salpêtrière Hospital, Paris, France, 5Department of Neuroradiology, Pitié-Salpêtrière Hospital, AP-HP, Paris, France, 6Biogen Inc., Cambridge, MA, United States, 7Department of Neurology, Pitié-Salpêtrière Hospital, AP-HP, Paris, France, 8Department of Nuclear Medicine, Pitié-Salpêtrière Hospital, AP-HP, Paris, France, 9National Reference Center for Rare Hypersomnias, Pitié-Salpêtrière Hospital, AP-HP, Paris, France
1Institut du Cerveau – ICM, INSERM U 1127, CNRS UMR 7225, Sorbonne Université, Paris, France, 2ICM, Centre de NeuroImagerie de Recherche – CENIR, Paris, France, 3ICM, Team “Movement Investigations and Therapeutics” (MOV’IT), Paris, France, 4National Institute of Health and Medical Research - INSERM, Clinical Investigation Centre, Pitié-Salpêtrière Hospital, Paris, France, 5Department of Neuroradiology, Pitié-Salpêtrière Hospital, AP-HP, Paris, France, 6Biogen Inc., Cambridge, MA, United States, 7Department of Neurology, Pitié-Salpêtrière Hospital, AP-HP, Paris, France, 8Department of Nuclear Medicine, Pitié-Salpêtrière Hospital, AP-HP, Paris, France, 9National Reference Center for Rare Hypersomnias, Pitié-Salpêtrière Hospital, AP-HP, Paris, France
Dopamine, neuromelanin and iron undergo neurodegeneration in
Parkinson’s disease. We investigated the spatial evolution of these processes
in the nigrostriatal system, along with their interrelationship, time of onset
and relative temporal ordering.
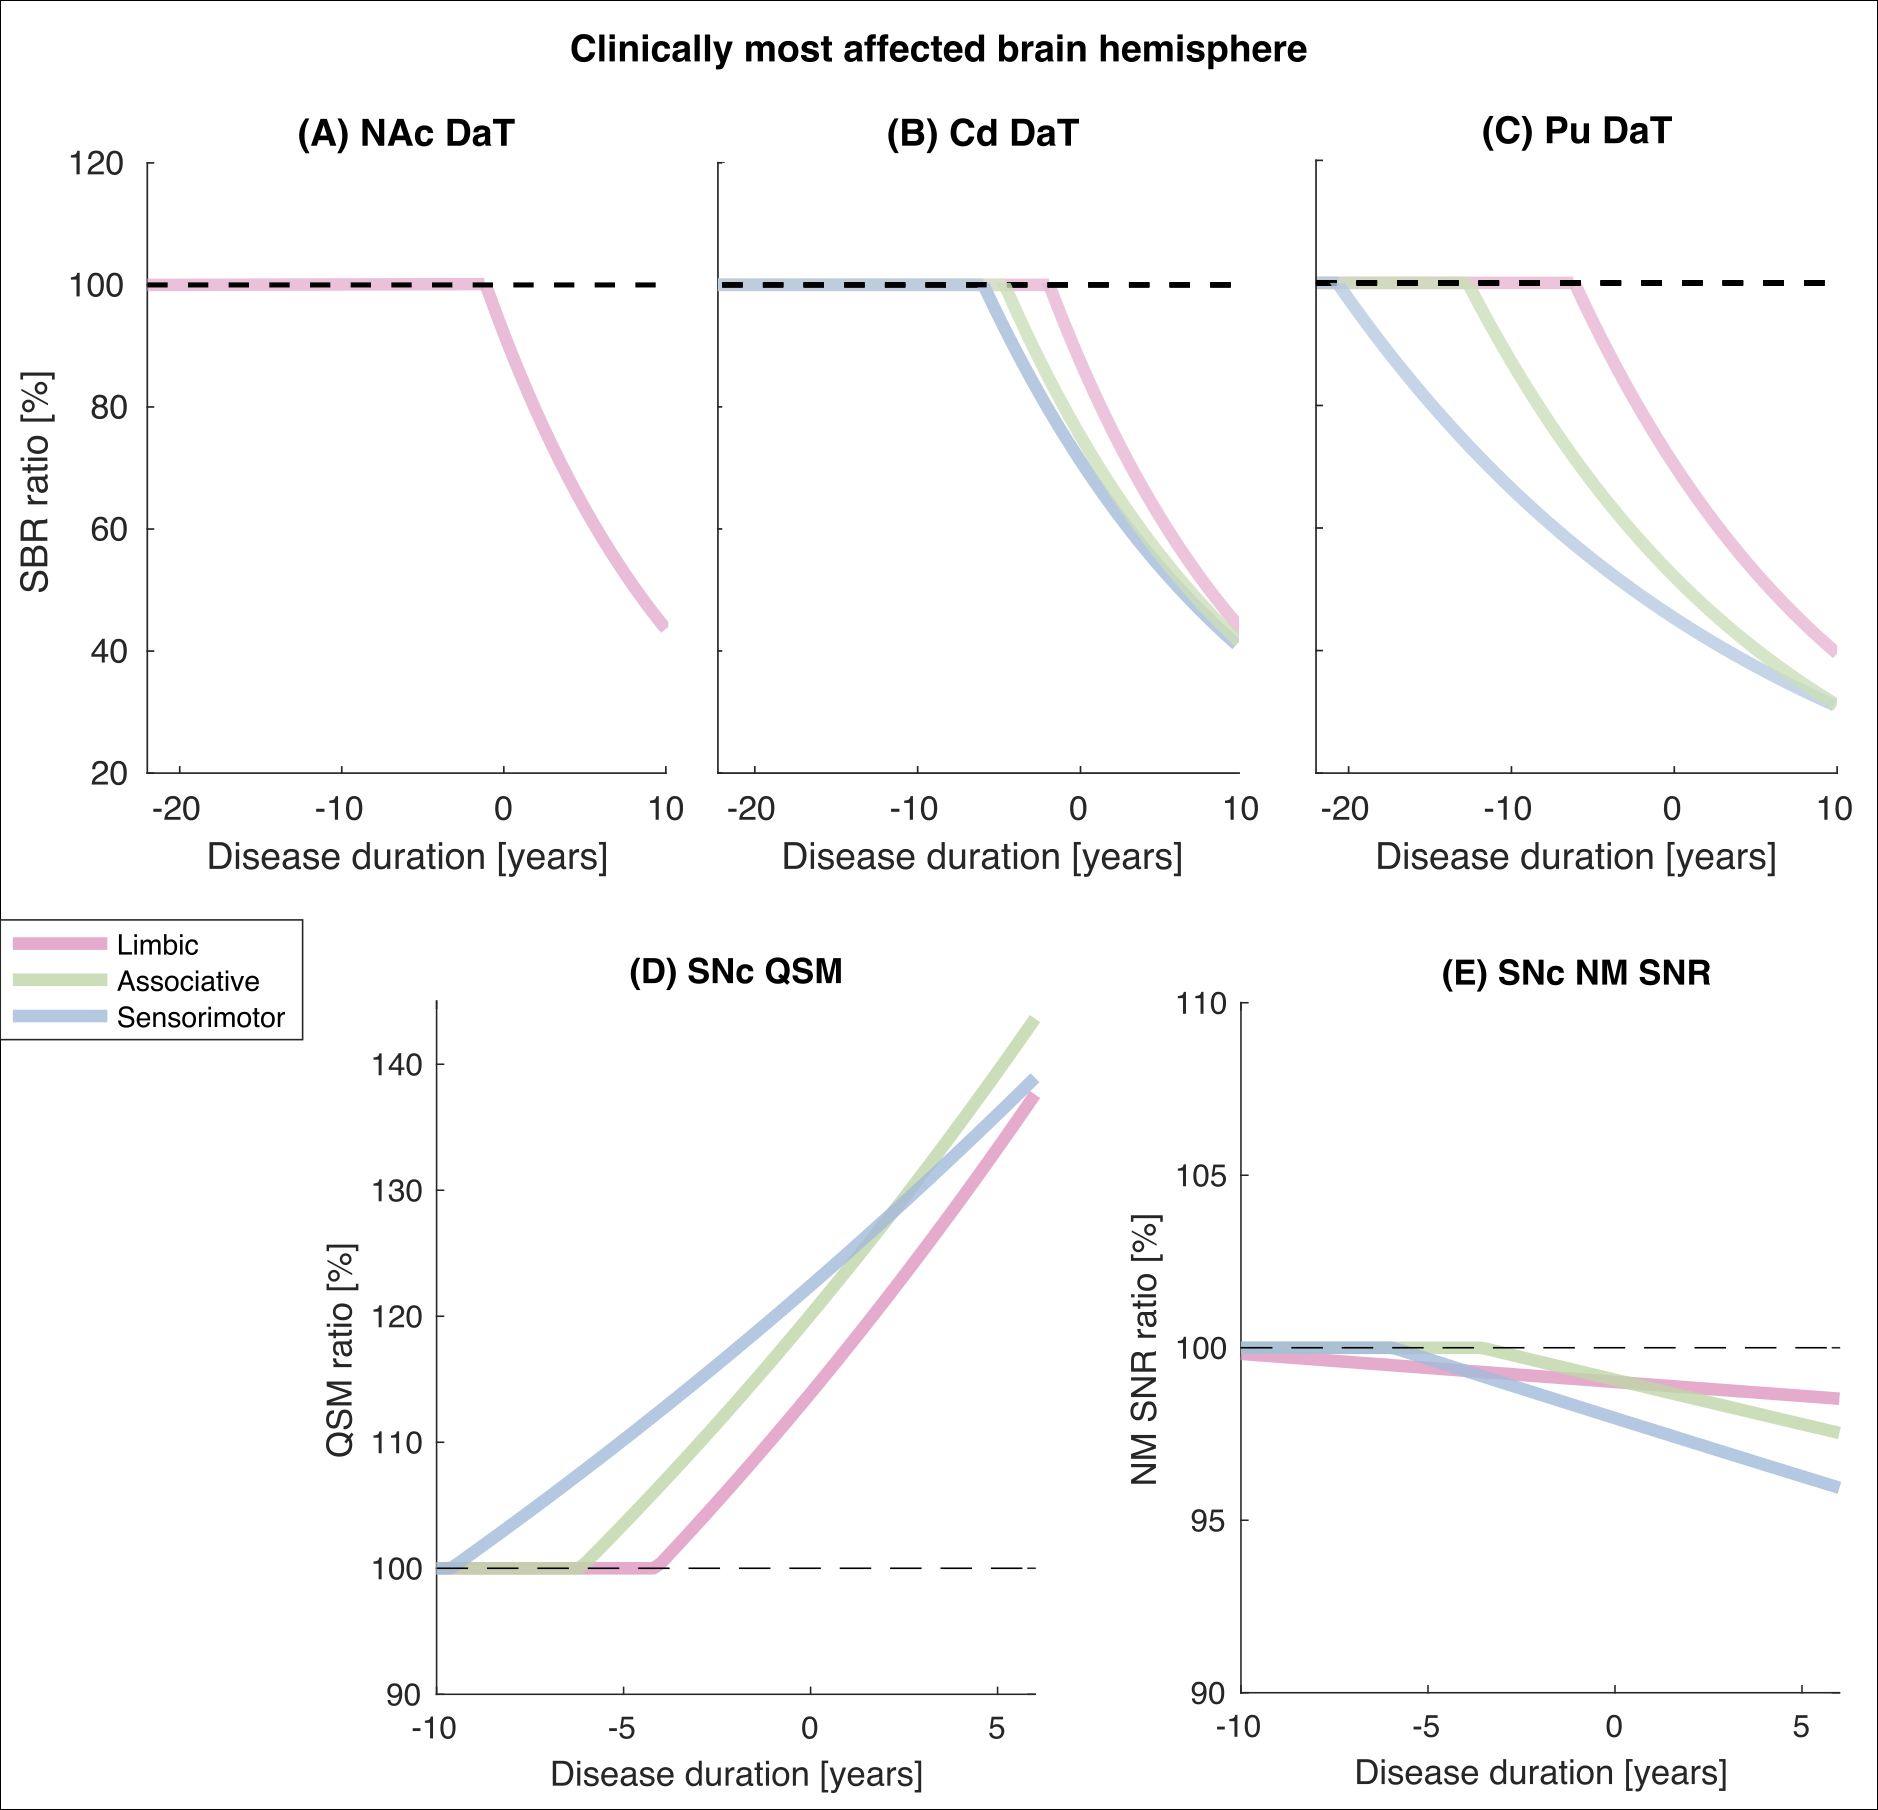
Figure 2: Change over disease duration in striatal DaT,
SNc NM and SNc iron in PDs relative to HCs. For all PDs relative to HCs, in
each functional subregion of the striatum (A-C) and SNc (D, E) in
the most affected brain hemisphere, the mono-exponential fitting functions for the
percent ratios of DaT striatal binding ratio (SBR), NM SNR and QSM are plotted
against disease duration
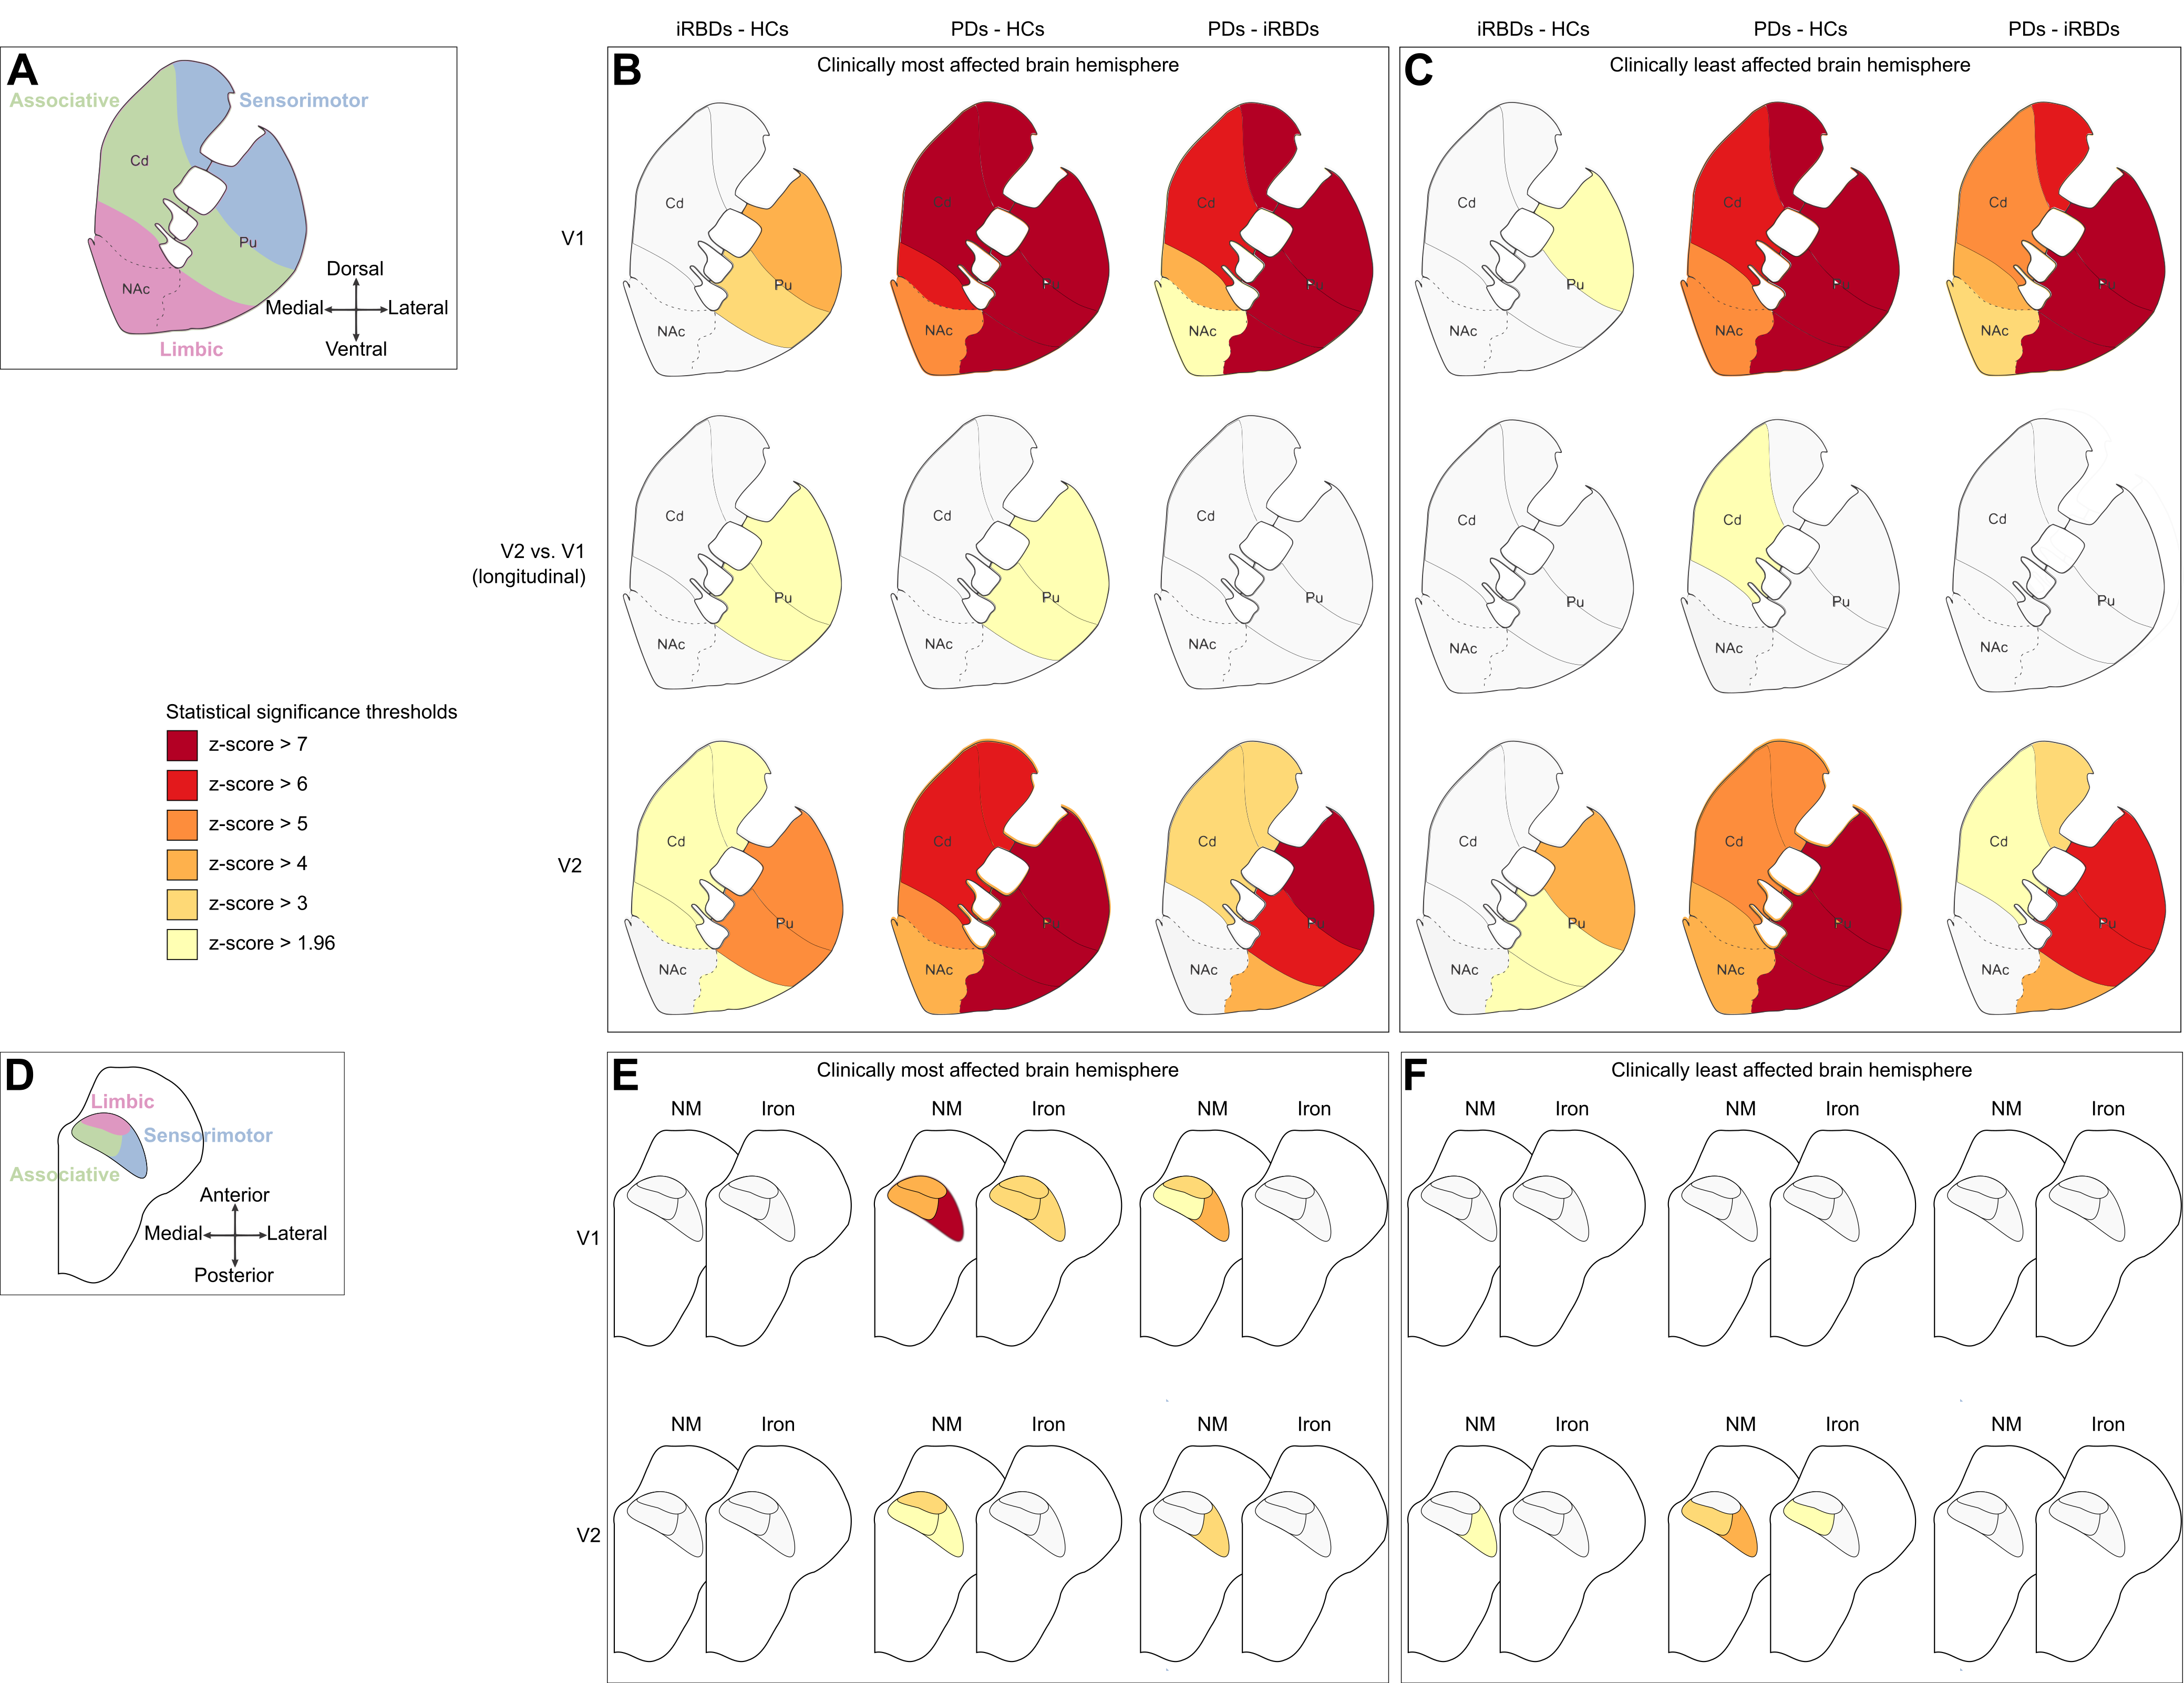
Figure 1: Group differences in striatal DaT and SNc NM
and iron levels. Functional subregions in the striatum (A) and the
SNc (D). The panels show the results of the statistical comparison
between groups in the clinically most (B, E) and least affected brain
hemispheres (C, F). Each panel shows the inter-group comparison between
iRBDs and HCs (left column), PDs and HCs (centre column), or PDs and iRBDs
(right column). P-values were converted into z-scores