Yue Xing1,2,3, Saadnah Naidu1,2,3, Halim Abdul-Sapuan1,2,3, Ali-Reza Mohammadi-Nejad2,3, Jonathan Evans4, Ofer Pasternak5, Stamatios Sotiropoulos2,3, Christopher R. Tench1,3, and Dorothee P. Auer1,2,3
1Division of Clinical Neuroscience, Queen’s Medical Centre, University of Nottingham, Nottingham, United Kingdom, 2Sir Peter Mansfield Imaging Centre, University of Nottingham, Nottingham, United Kingdom, 3NIHR Nottingham Biomedical Research Centre, University of Nottingham, Nottingham, United Kingdom, 4Department of Neurology, Nottingham University Hospital Trust, Nottingham, United Kingdom, 5Departments of Psychiatry and Radiology (O.P.), Brigham and Women's Hospital, Harvard Medical School, Boston, MA, United States
1Division of Clinical Neuroscience, Queen’s Medical Centre, University of Nottingham, Nottingham, United Kingdom, 2Sir Peter Mansfield Imaging Centre, University of Nottingham, Nottingham, United Kingdom, 3NIHR Nottingham Biomedical Research Centre, University of Nottingham, Nottingham, United Kingdom, 4Department of Neurology, Nottingham University Hospital Trust, Nottingham, United Kingdom, 5Departments of Psychiatry and Radiology (O.P.), Brigham and Women's Hospital, Harvard Medical School, Boston, MA, United States
Longitudinal NM signal-loss and FW increase was seen in PD throughout the SN with significant acceleration compared to controls in the ventral-SN, but there was no between-metrics correlation, suggesting that these promising serial biomarkers may track different aspects of PD progression.
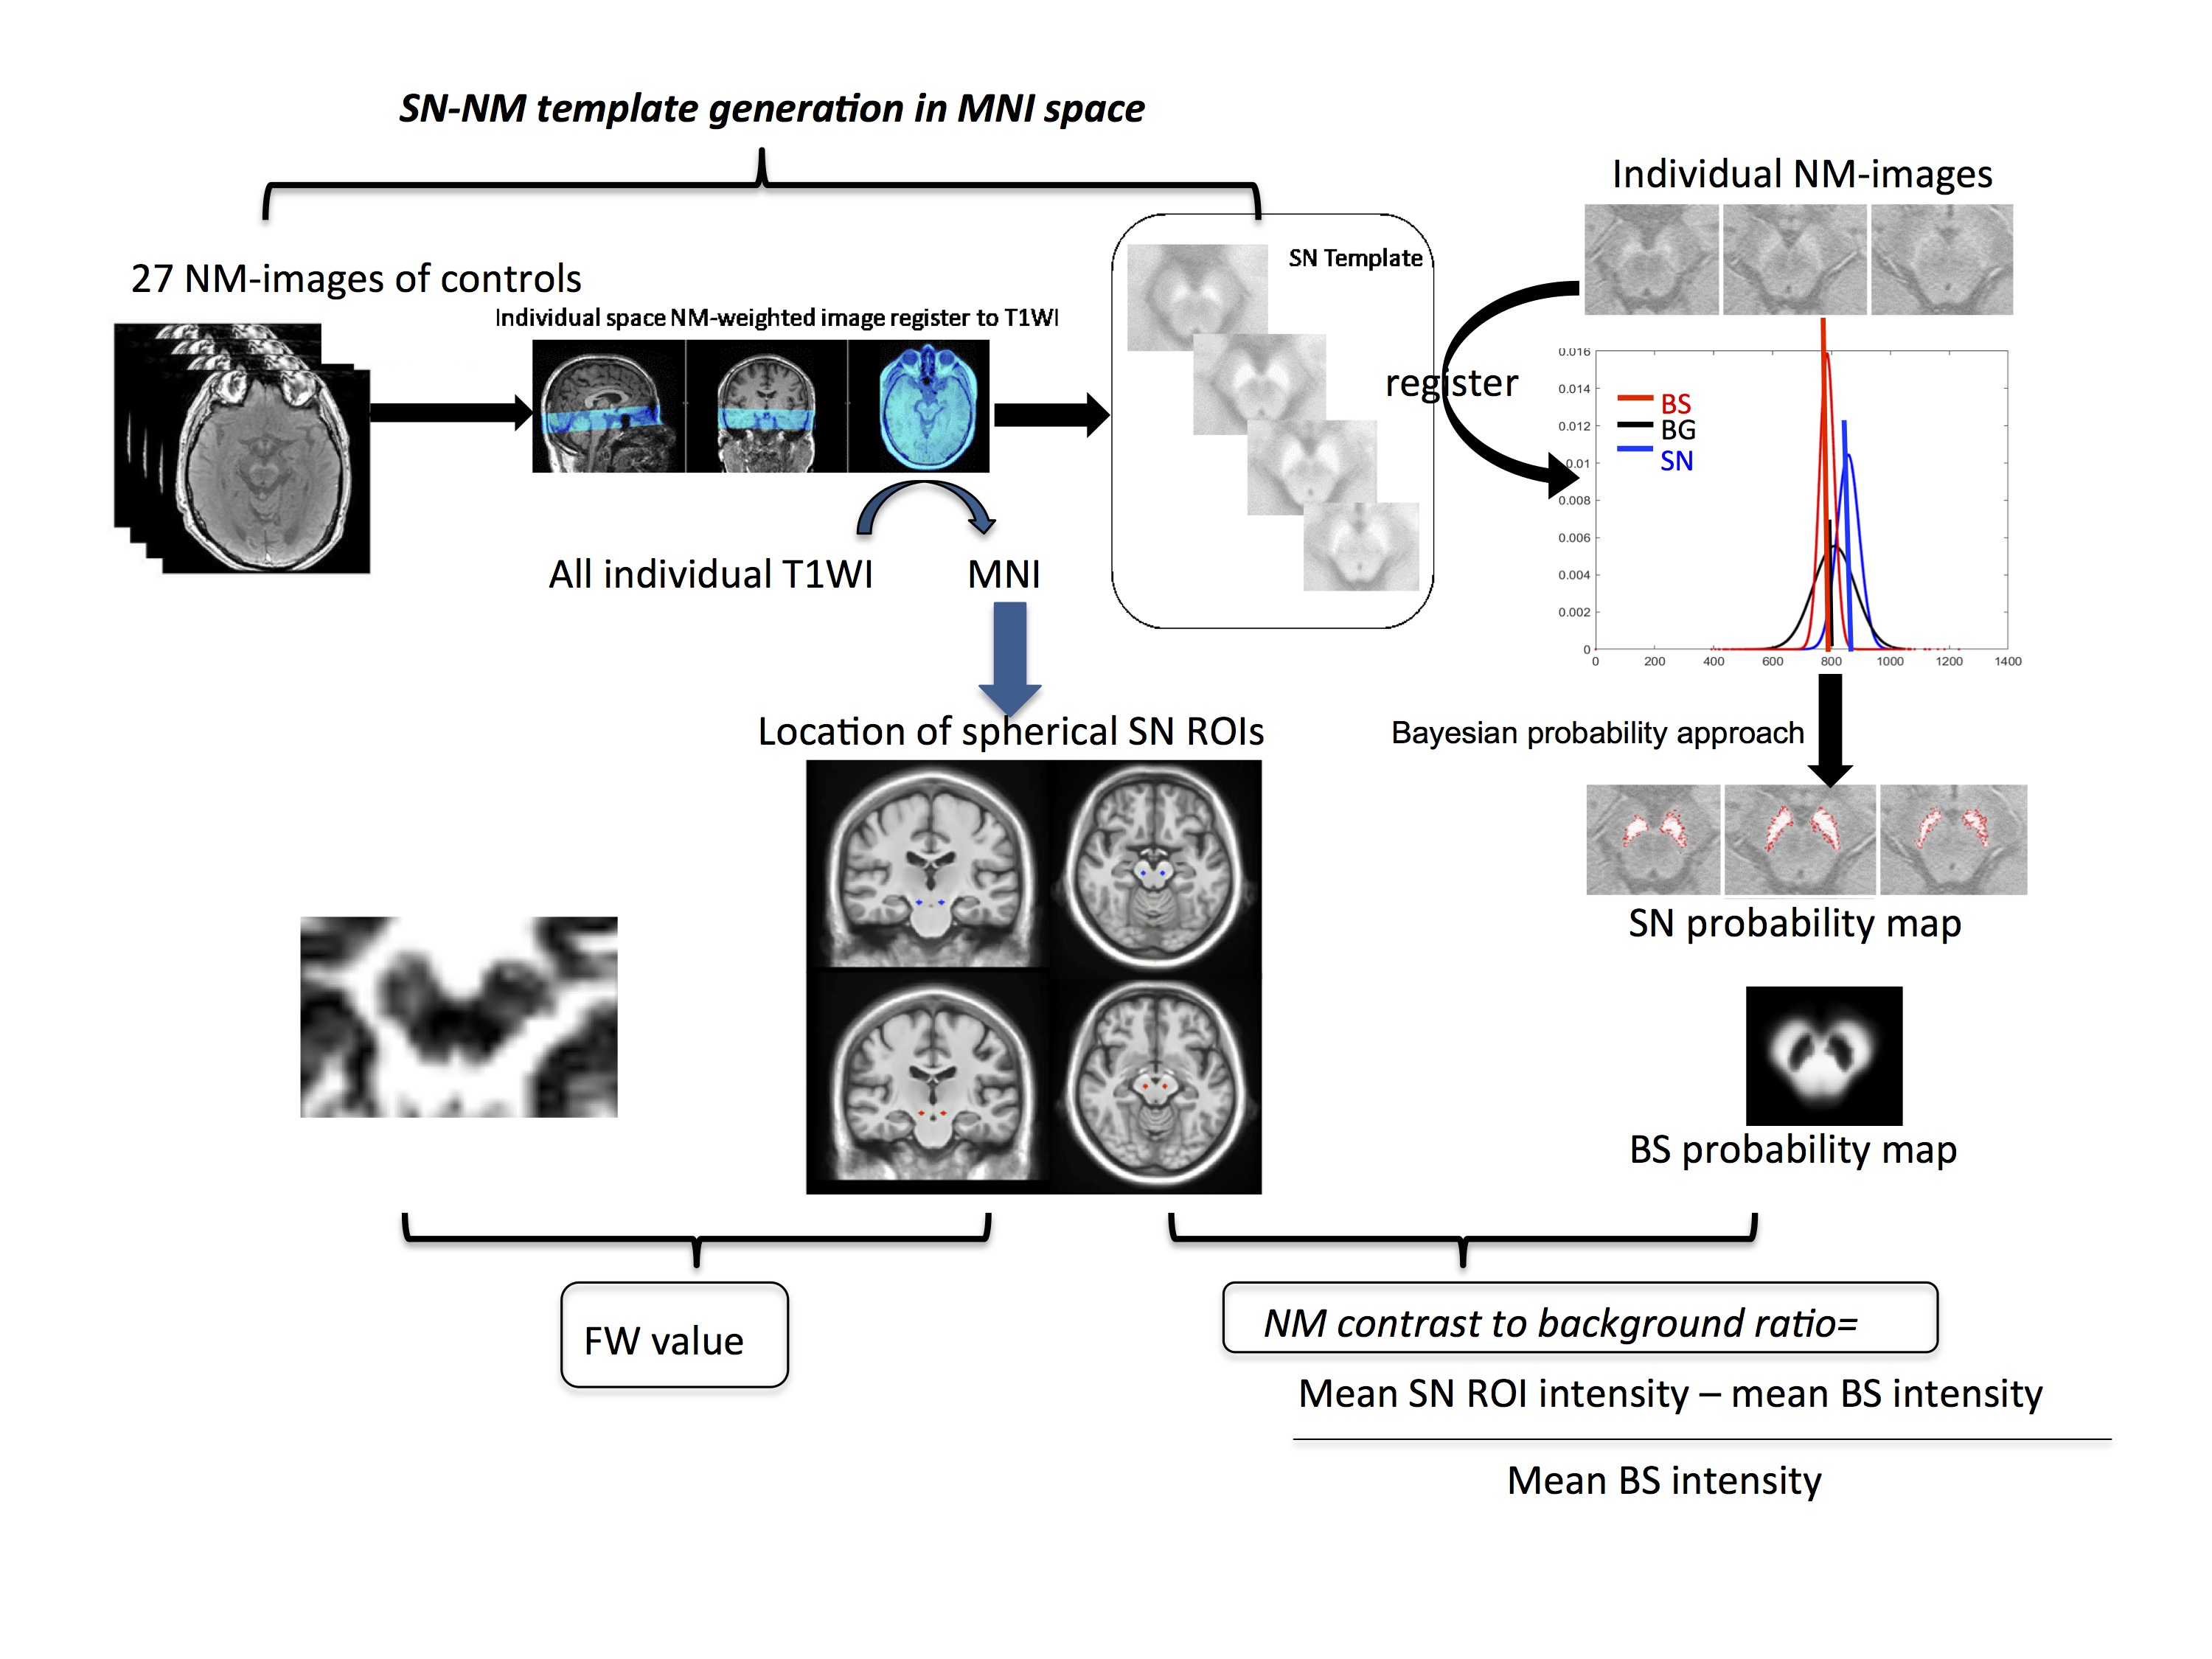
Figure 1. Illustration of the
analysis pipeline: first, an age-specific healthy
control’s mean brainstem template was generated, along with their respective spatial prior probability maps with three classes: brainstem outside of the SN (BS), SN, and
irrelevant background (BG and it is not shown here). The same procedure was
performed to transform NM-MRIs in the same space as the prior probability maps.
Finally, the Bayesian classification was applied for partitioning the SN from
the brainstem in both image intensity and in space and the mean intensity of
the brainstem was extracted.
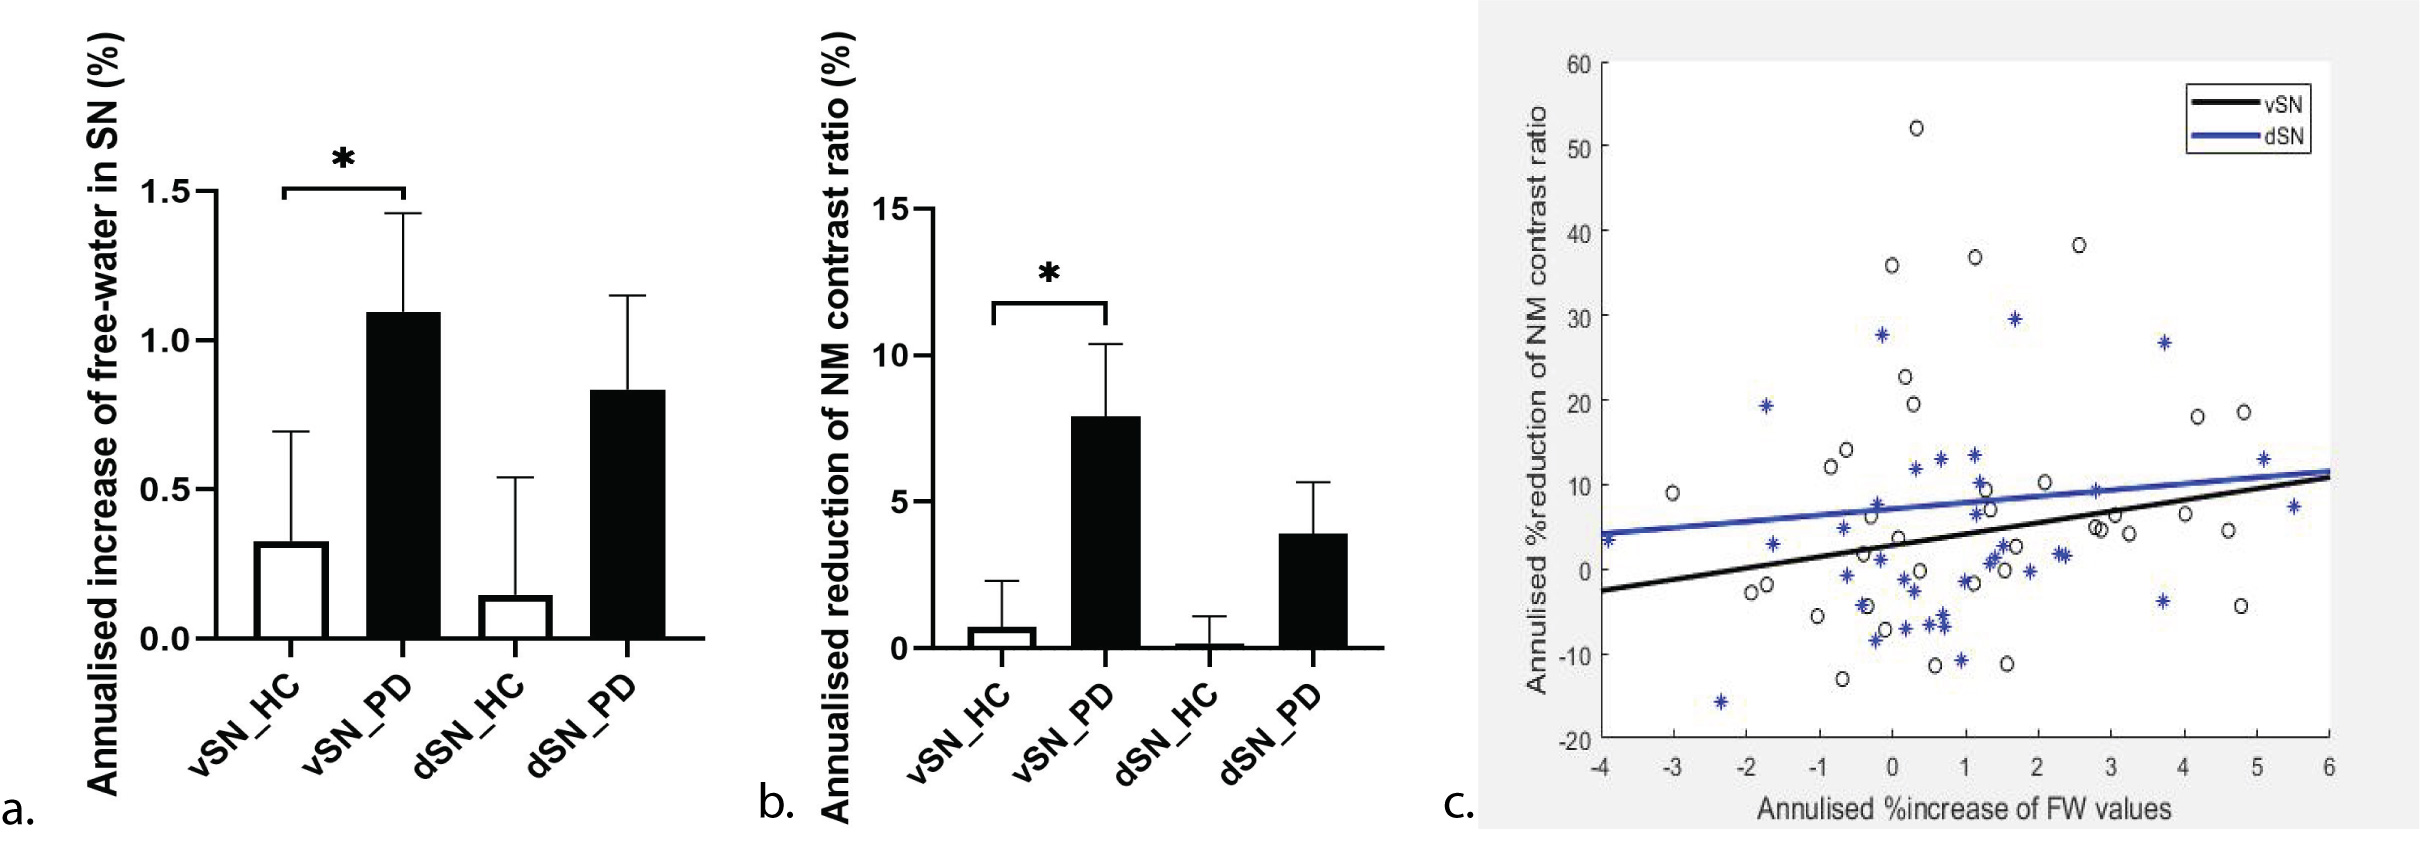
Figure 2.
The
annualized %change of MRI metrics (a. % increase Free-water and b. % reduction
of NM contrast to background ratio) of ventral and dorsal SN in PD and
controls. c. The scatter plot of annualized % increase of FW values versus the
annualized % reduction of NM contrast ratio in PD. Error bars show SEM.