Laila khedher1, Jean Marie Bonny2, Ana Marques3, Marie Vidailhet4, Frédéric Torny5, Luc Defebvre6, Stéphane Thobois7, Elena Moro8, Philippe Remy9, Christian Geny10, Wassilios Meissner11, Solène Frismand12, Anne Doe de Maindreville13, Jean-Luc Houeto14, Olivier Rascol15, and Franck Durif1,3
1University Clermont Auvergne, Clermont Ferrand, France, 2INRA, UR370 Qualité des Produits Animaux, Saint Genès Champanelle, France, 3CHU Clermont Ferrand, Clermont Ferrand, France, 4Fédération des maladies du système nerveux GH La Pitié Salpêtrière, Paris, France, 5CHU Dupuytren, Service de Neurologie, Limoges, France, 6Hopital Roger Salengro, Service de Neurologie et Pathologie du Mouvement, Lille, France, 7Hopital Pierre Wertheimer, Neurologie C, Lyon, France, 8CHU de Grenoble, Service de Neurologie, Grenoble, France, 9Hopital Henri Mondor, Service de Neurologie, Creteil, France, 10CHRU Montpellier, Service de Neurologie, Montpellier, France, 11CHU Bordeaux, Service de Neurologie, Bordeaux, France, 12Hopital Central-CHU Nancy, Service de Neurologie, Nancy, France, 13Pole Neurologie-Gériatrie, Reims, France, 14CHU de Poitiers, Poitiers, France, 15Centre d’Investigation Clinique CIC 1436, CHU PURPAN-Place du Dr Baylac, Hopital Pierre Paul Riquet, Toulouse, France
1University Clermont Auvergne, Clermont Ferrand, France, 2INRA, UR370 Qualité des Produits Animaux, Saint Genès Champanelle, France, 3CHU Clermont Ferrand, Clermont Ferrand, France, 4Fédération des maladies du système nerveux GH La Pitié Salpêtrière, Paris, France, 5CHU Dupuytren, Service de Neurologie, Limoges, France, 6Hopital Roger Salengro, Service de Neurologie et Pathologie du Mouvement, Lille, France, 7Hopital Pierre Wertheimer, Neurologie C, Lyon, France, 8CHU de Grenoble, Service de Neurologie, Grenoble, France, 9Hopital Henri Mondor, Service de Neurologie, Creteil, France, 10CHRU Montpellier, Service de Neurologie, Montpellier, France, 11CHU Bordeaux, Service de Neurologie, Bordeaux, France, 12Hopital Central-CHU Nancy, Service de Neurologie, Nancy, France, 13Pole Neurologie-Gériatrie, Reims, France, 14CHU de Poitiers, Poitiers, France, 15Centre d’Investigation Clinique CIC 1436, CHU PURPAN-Place du Dr Baylac, Hopital Pierre Paul Riquet, Toulouse, France
The results obtained in this study determine that MRI-R2* mapping is a technique for detecting subtle iron-related variations in subcortical regions of PD patients. In addition, the developed strategy improves its specificity and makes R2* a credible biomarker to monitor the evolution of PD.

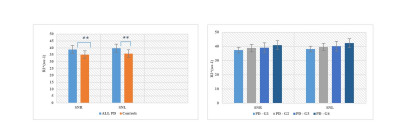
Figure 1. R2* (sec-1) in each region
of interest ; in PD patients and controls and between PD sub-groups (based
on disease duration ; disease (PD - G1 <5 years; PD - G2, between 5 and
10 years; PD - G3, between 10 and 15 years and PD - G4> 15 years). The p-values
were calculated using two samples t-tests. ***p≤0.0001 **p≤0.005, *p≤0.05.

Figure 2. R2*
normalized (sec-1); in PD patients and controls and between PD sub-groups (based
on disease duration ; disease (PD - G1 <5 years; PD - G2, between 5 and
10 years; PD - G3, between 10 and 15 years and PD - G4> 15 years). The p-values
were calculated using two samples t-tests. ***p≤0.0001 **p≤0.005, *p≤0.05.
