Ek T Tan1, Kelly C Zochowski1, Kenneth Serrano1, and Darryl B Sneag1
1Radiology and Imaging, Hospital for Special Surgery, New York, NY, United States
1Radiology and Imaging, Hospital for Special Surgery, New York, NY, United States
Diffusion MRI-based apparent fiber diameter (AFD) in denervated muscle were smaller than non-denervated and controls by 11 µm and 23 µm respectively. Correlation of the AFD with T2 and fat fraction were stronger than that for standard FA.
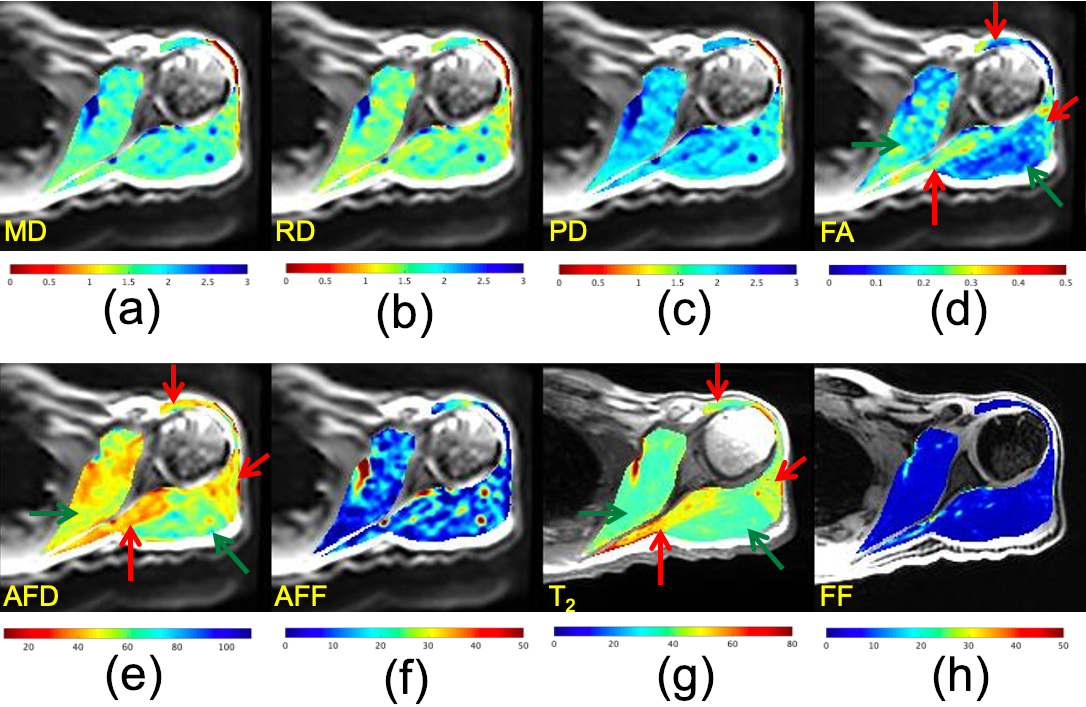
Figure 2. Quantitative maps from a 47-yo M with muscle edema pattern observed in the left infraspinatus, and anterior and middle deltoid. The MD, RD and AD maps (in µm2/ms) do not provide contrast in denervated muscles (red arrows) vs. non-denervated muscles (green arrows), but FA, AFD (µm) and T2-maps (ms) do. No fatty infiltration was observed in the FF (%) maps. Most pixels in the AFF (%) were mostly low (<20%). The diffusion maps were overlaid on diffusion trace images, while the T2-map was overlaid on the T2 magnitude image, and the FF map was overlaid on the Dixon water image.
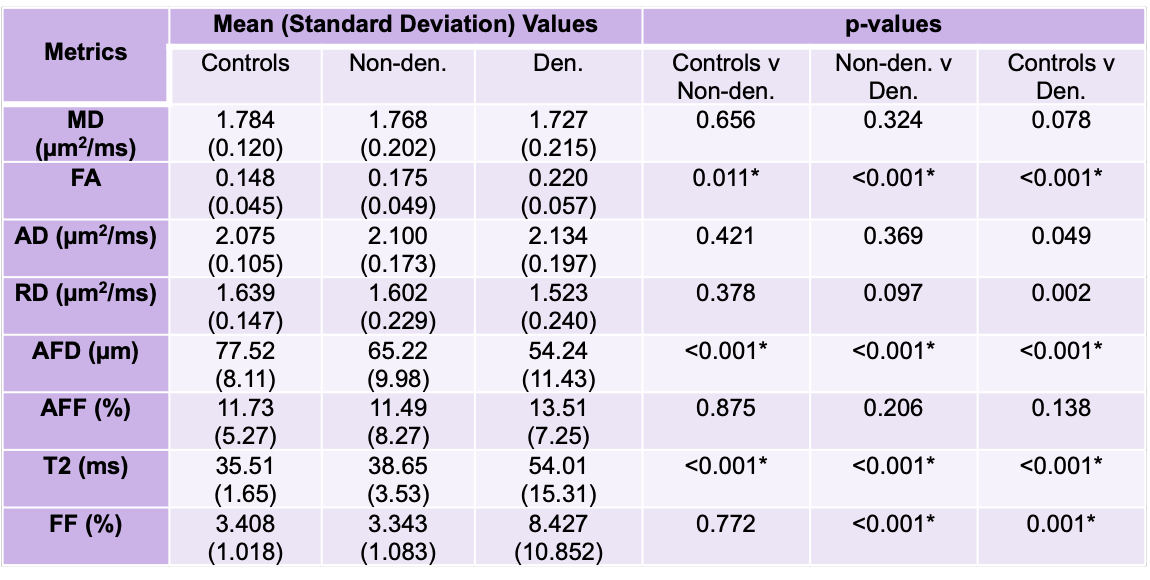
Table 2. Summary of in vivo results comparing healthy controls vs. non-denervated patients (Non-den.) vs. denervated patient muscles (Den.), with mean and p-values from two-sample t-tests (α=0.05), and statistical significance with Holm-Bonferroni correction for multiple comparison indicated (by *).