Thom T. J. Veeger1, Gustav J. Strijkers2, Valentina Mazzoli3, Hans C. van Assen1, Jurriaan H. de Groot4, Lukas M. Gottwald5, Aart J. Nederveen5, Hermien E. Kan1,6, and Melissa T. Hooijmans2
1Radiology, Leiden University Medical Center, Leiden, Netherlands, 2Biomedical Engineering & Physics, Amsterdam Movement Sciences, Amsterdam University Medical Center, Location AMC, Amsterdam, Netherlands, 3Radiology, Stanford University, Stanford, CA, United States, 4Rehabilitation Medicine, Leiden University Medical Center, Leiden, Netherlands, 5Radiology and Nuclear Medicine, Amsterdam Movement Sciences, Amsterdam University Medical Center, Location AMC, Amsterdam, Netherlands, 6Duchenne Center Netherlands, Veenendaal, Netherlands
1Radiology, Leiden University Medical Center, Leiden, Netherlands, 2Biomedical Engineering & Physics, Amsterdam Movement Sciences, Amsterdam University Medical Center, Location AMC, Amsterdam, Netherlands, 3Radiology, Stanford University, Stanford, CA, United States, 4Rehabilitation Medicine, Leiden University Medical Center, Leiden, Netherlands, 5Radiology and Nuclear Medicine, Amsterdam Movement Sciences, Amsterdam University Medical Center, Location AMC, Amsterdam, Netherlands, 6Duchenne Center Netherlands, Veenendaal, Netherlands
Spatially heterogeneous strain rates were detected along the length of
the TA muscle during movement, with smallest and largest positive and negative
strain rate eigenvalues in the most proximal and distal muscle segment,
respectively.
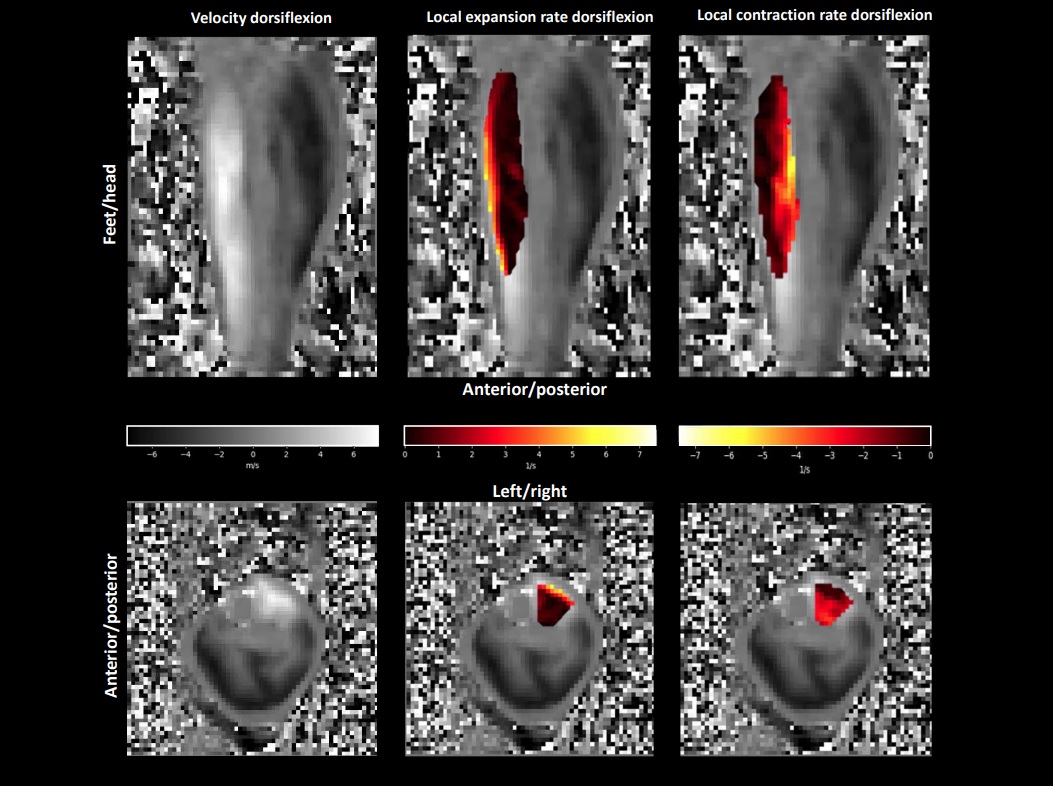
Fig. 2) Sagittal (top) and axial (bottom) phase
contrast velocity images (left) and local expansion (middle) and contraction
(right) rate maps of a representative subject for the load condition during maximal
dorsiflexion velocity.
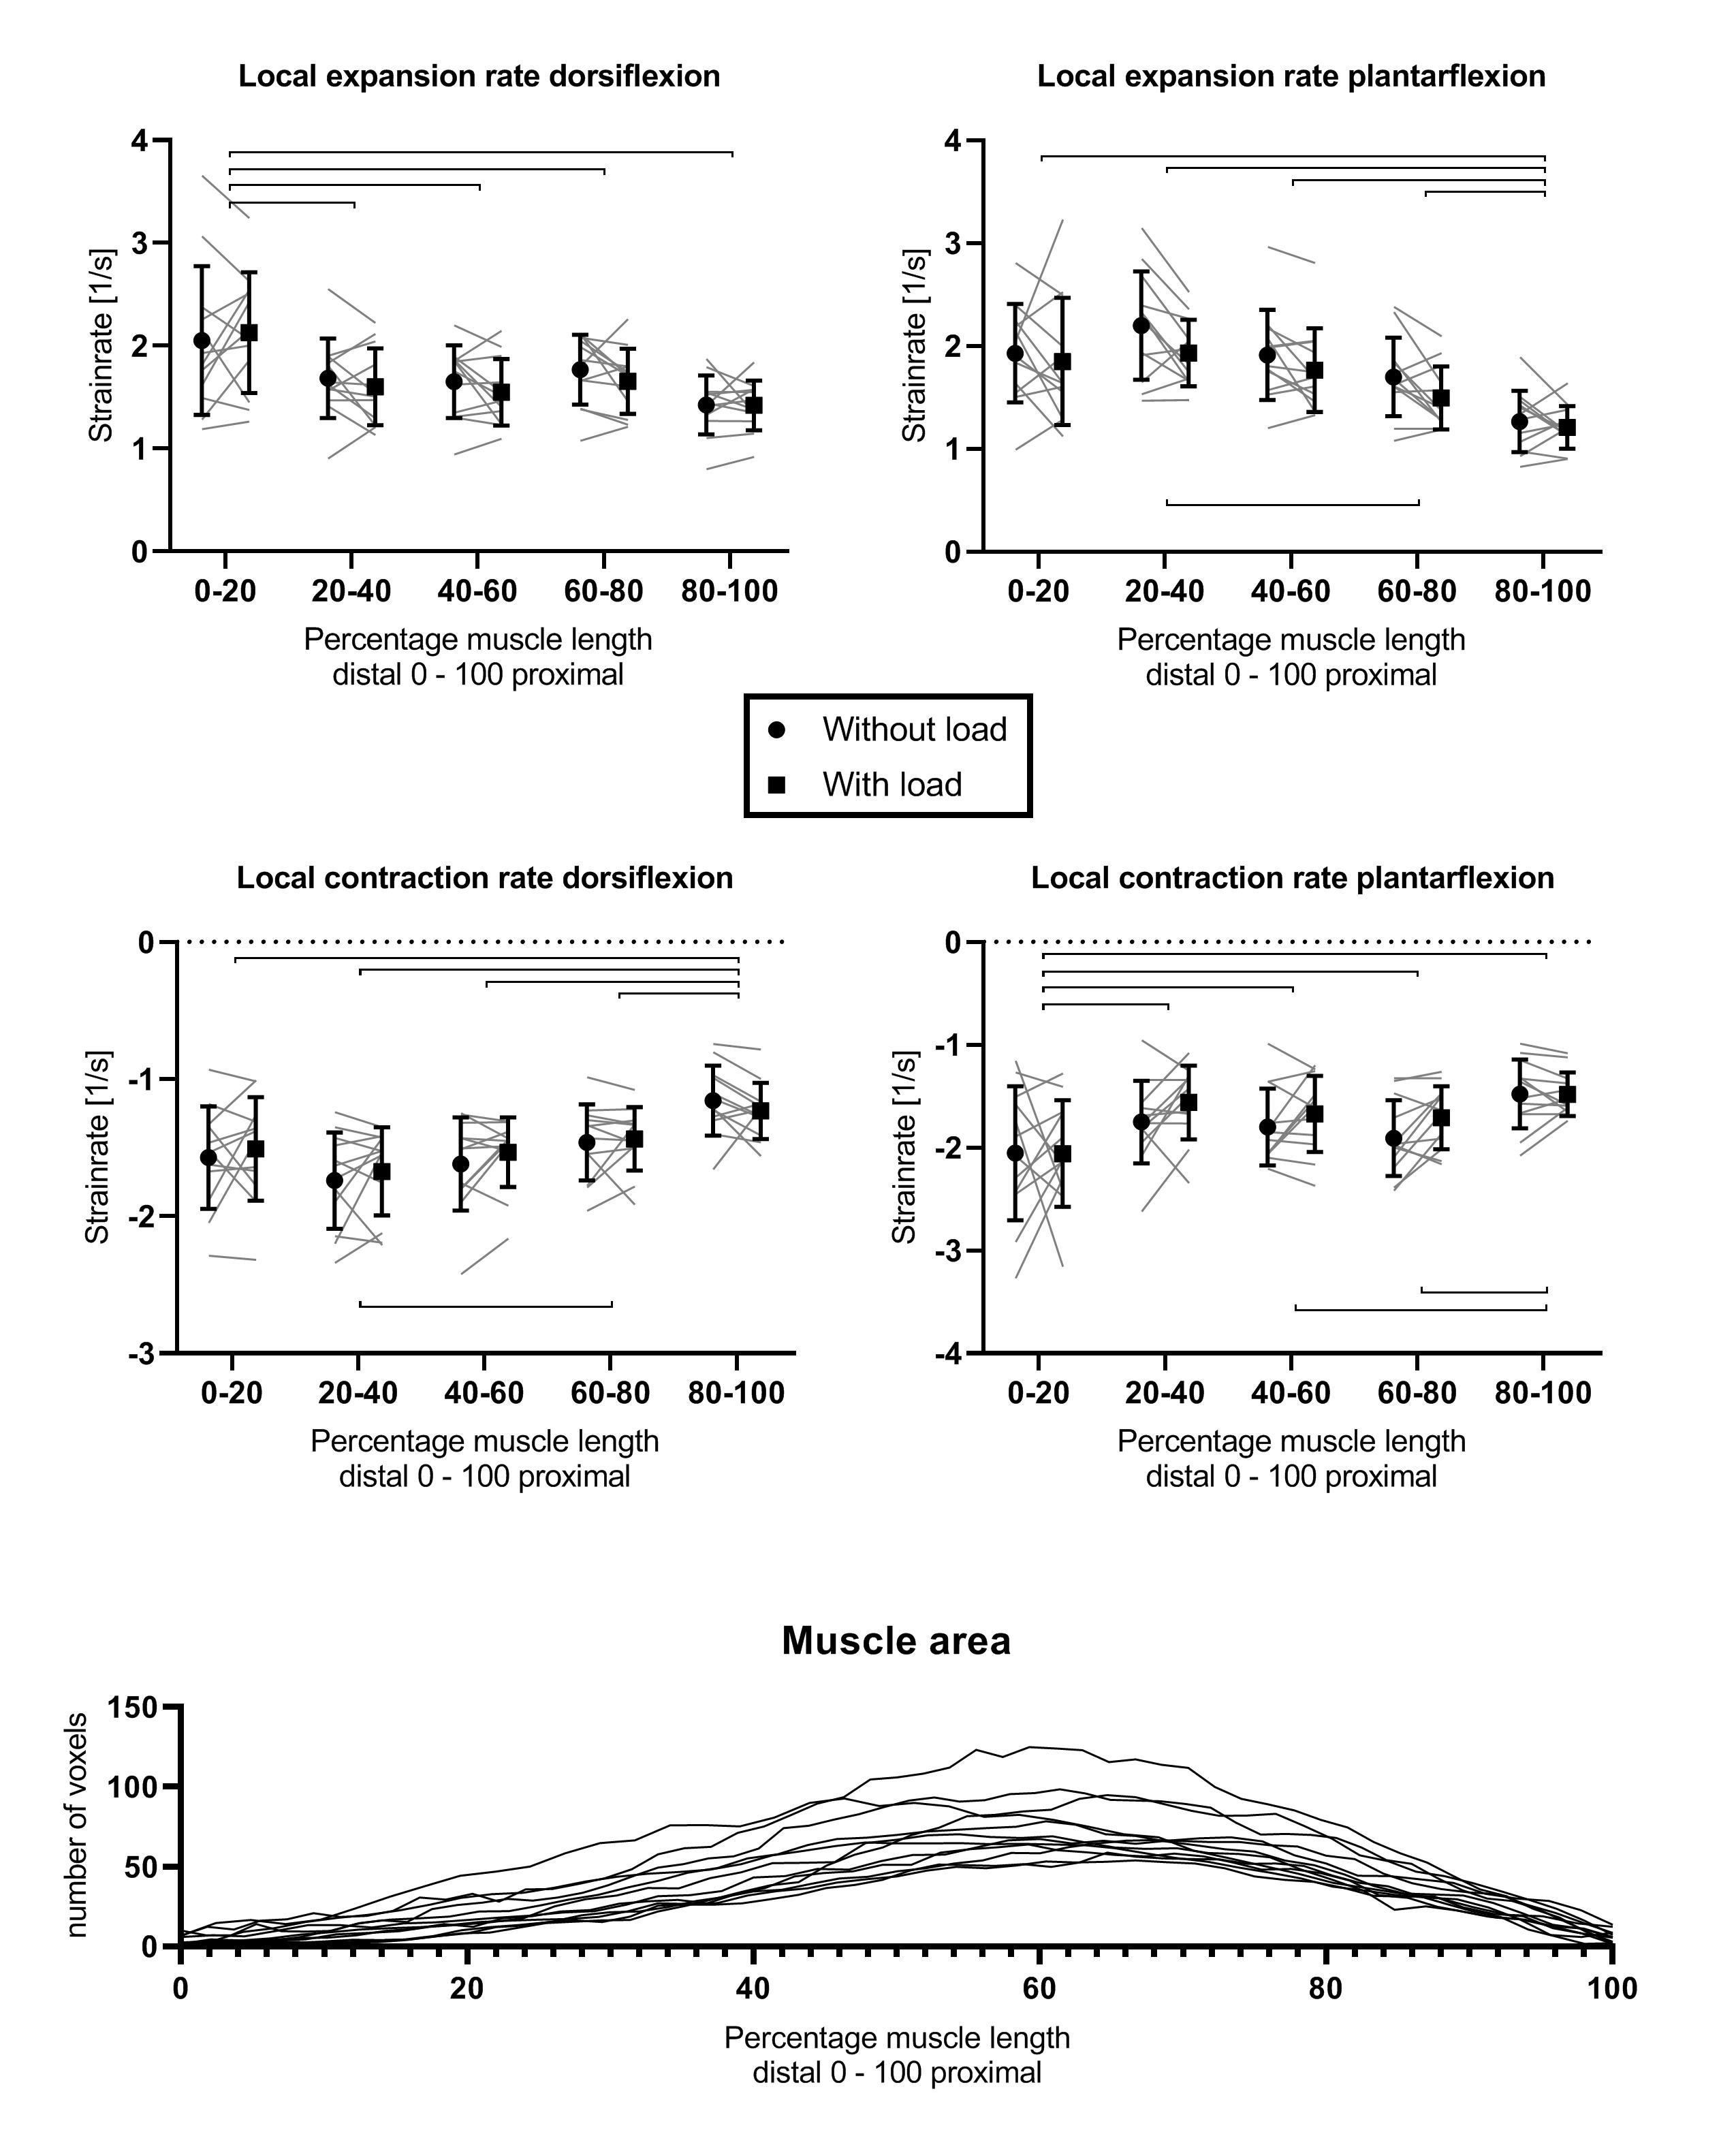
Fig. 4) Line graphs showing local contraction and expansion rate during dorsi-/plantarflexion without and with load for five muscle segments. Individual subjects are indicated with grey lines (connecting with and
without load conditions) and in black the mean and standard deviation of the
group per segment and per load condition. Significant differences in local
expansion and contraction rates between proximodistal segments are shown with
hooked lines. Additionally, at the bottom, muscle area in number
of voxels is shown as a percentage of muscle length (distal 0-100 proximal).