1Department of Neurology, UMC Utrecht Brain Center, University Medical Center, Utrecht, Utrecht, Netherlands, 2Department of Radiology, University Medical Center Utrecht, the Netherlands, Utrecht, Netherlands, 3Biostatistics & Research Support, Julius Center for Health Sciences and Primary Care, University Medical Center Utrecht, Utrecht, Netherlands, 4Department of Neurology and Child Neurology, UMC Utrecht Brain Center, University Medical Center, Utrecht, Utrecht, Netherlands, 5Department of Child Development and Exercise Center, University Medical Center Utrecht, the Netherlands, Utrecht, Netherlands
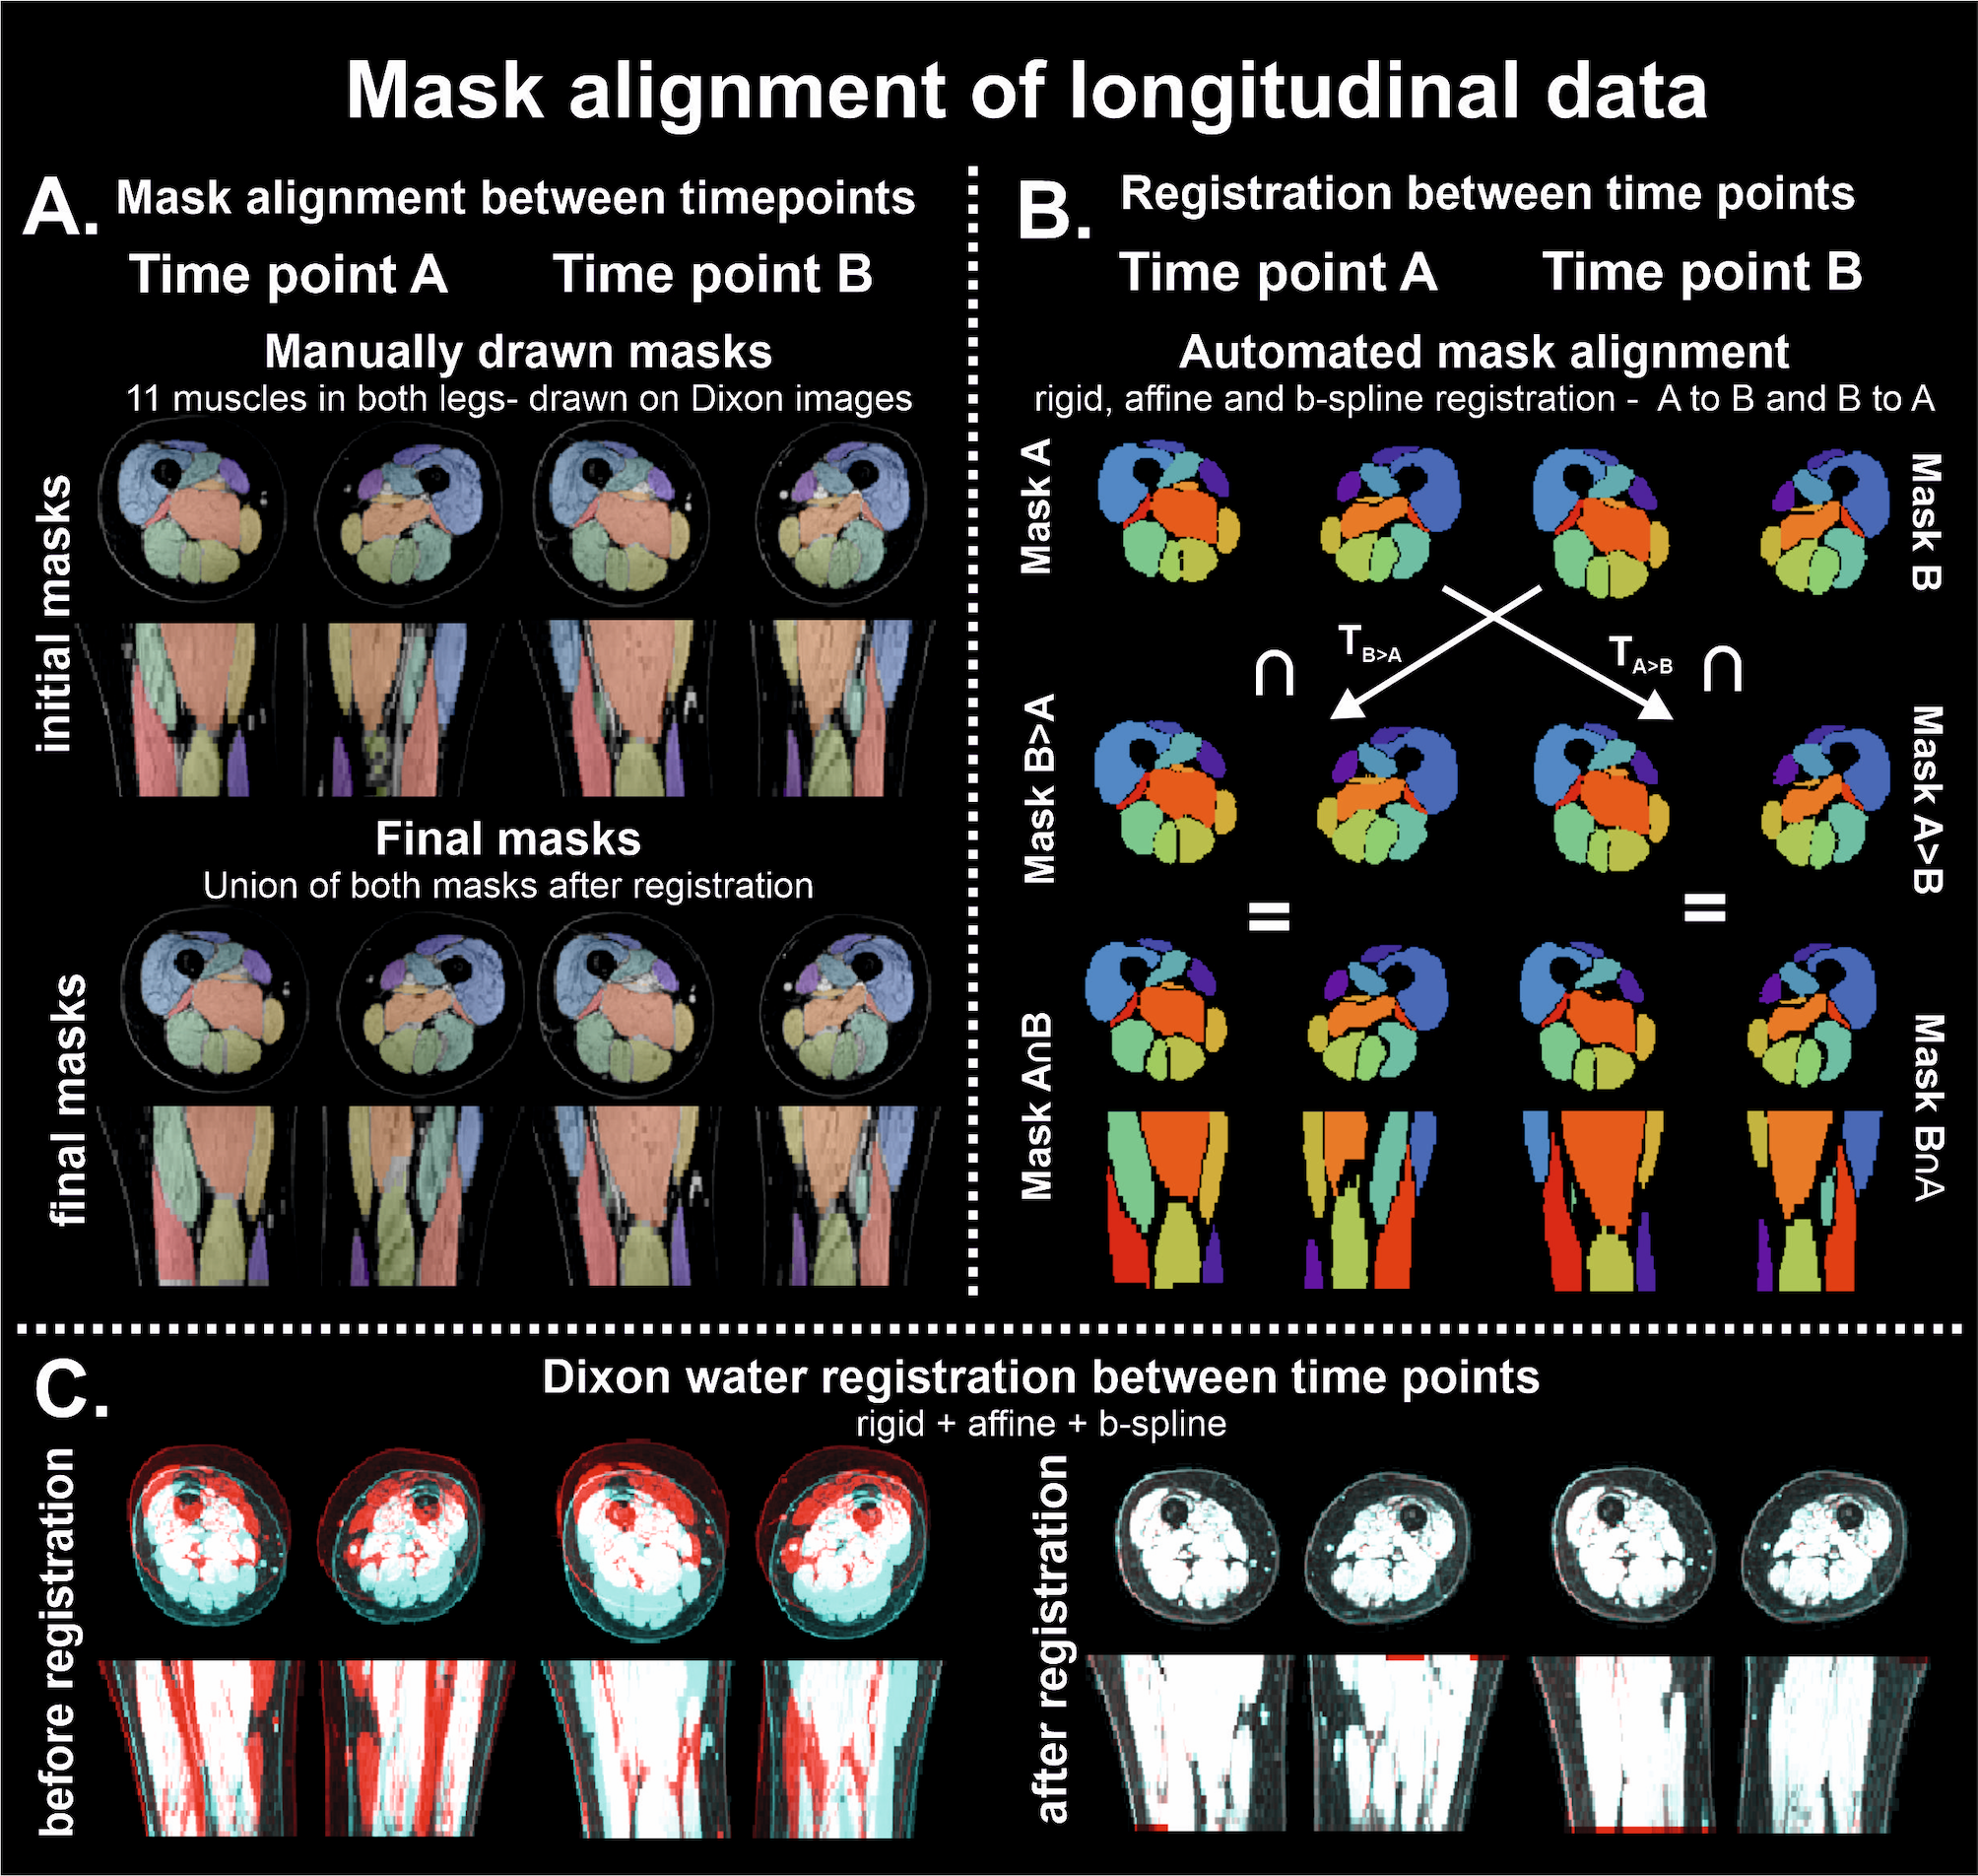
Illustration of pipeline and steps of mask alignment of longitudinal data
The methodology of alignment of imaging stacks is illustrated by the steps involving conversion of masks; initial and final masks in panel A and automated steps in mask alignment in panel B. In panel C, the images of time-point A and time-point B are rendered red and blue, to illustrate the incongruency between datasets before (left) and after (right) rigid, affine and b-spline registration. The non-corresponding regions can be identified as they maintain their respective color.
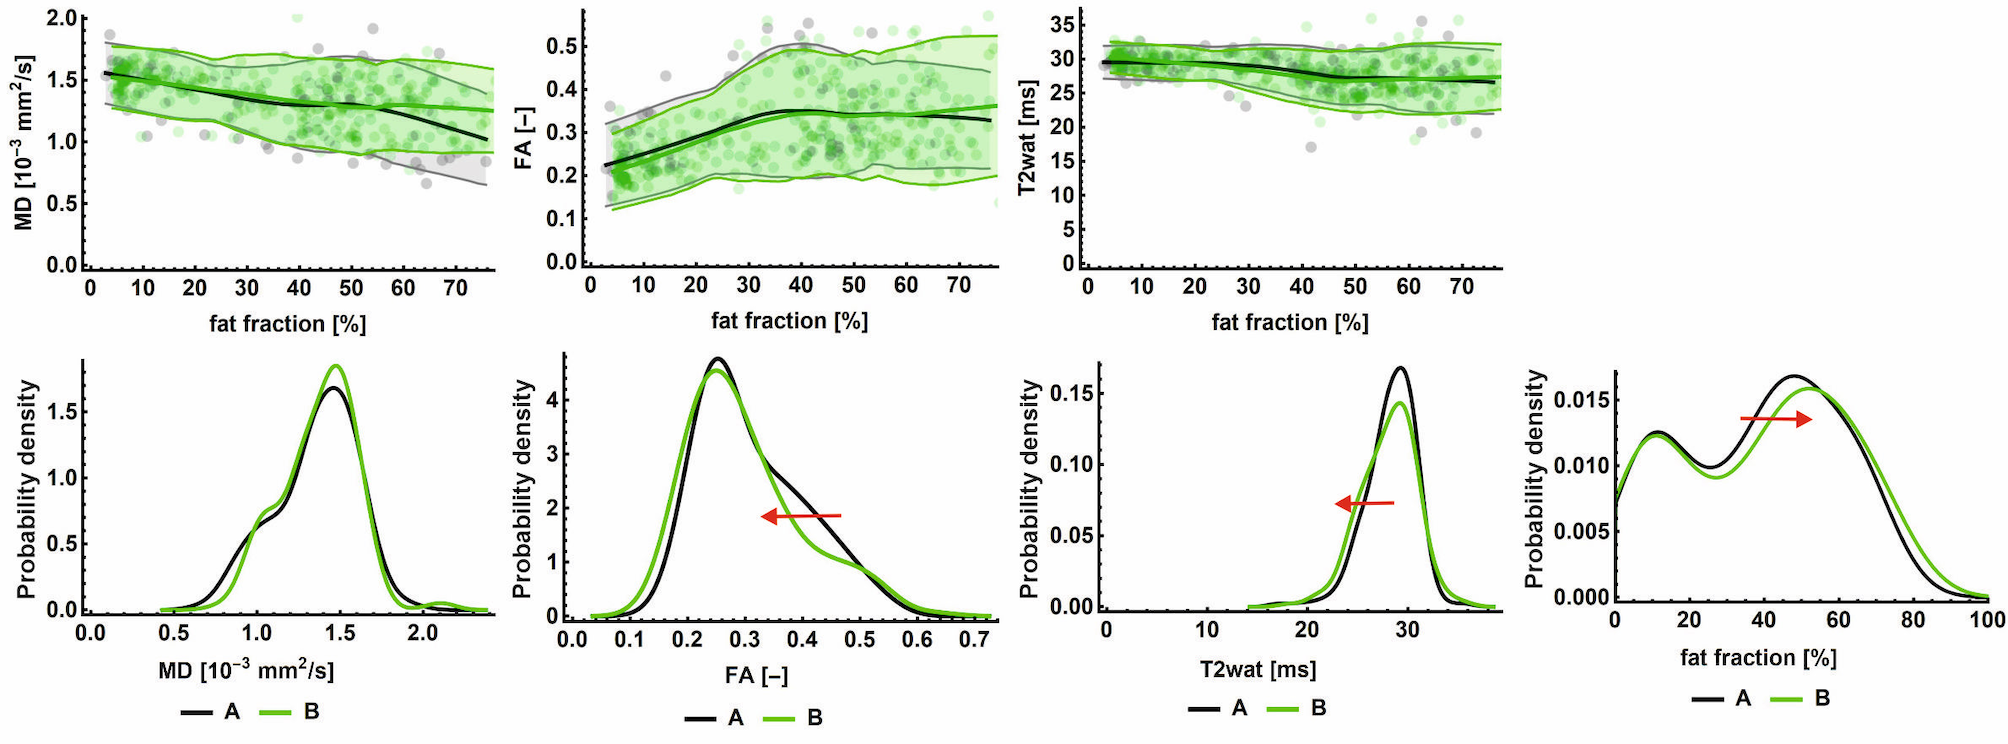
Histogram and plots of qMRI parameters of treatment-naïve cohort at both time-points
In the upper row, MD, FA and T2 are plotted against fat fraction, with each of the individual datapoints as dots, reduced to an average line using local regression with 95%-CI (shaded area). The bottom row represents the histograms of each of the qMRI parameters, the red arrow indicates significant changes and its direction. Time-point A is indicated in grey, and time-point B in green. All presented data is from the treatment-naïve cohort.