Can Wu1,2, Qi Peng3, William Paredes4, Moriel Vandsburger5, and Matthew K. Abramowitz4
1Department of Medical Physics, Memorial Sloan Kettering Cancer Center, New York, NY, United States, 2Philips Healthcare, Andover, MA, United States, 3Department of Radiology, Albert Einstein College of Medicine and Montefiore Medical Center, Bronx, NY, United States, 4Department of Medicine, Albert Einstein College of Medicine and Montefiore Medical Center, Bronx, NY, United States, 5Department of Bioengineering, University of California, Berkeley, Berkeley, CA, United States
1Department of Medical Physics, Memorial Sloan Kettering Cancer Center, New York, NY, United States, 2Philips Healthcare, Andover, MA, United States, 3Department of Radiology, Albert Einstein College of Medicine and Montefiore Medical Center, Bronx, NY, United States, 4Department of Medicine, Albert Einstein College of Medicine and Montefiore Medical Center, Bronx, NY, United States, 5Department of Bioengineering, University of California, Berkeley, Berkeley, CA, United States
Significant changes of T1ρ, intra- and extra-myocellular lipid ratio, ADC, and FA were
observed in patients with chronic kidney disease or dialysis compared to normal
controls. In addition, there was significant correlation between T1ρ and DTI
biomarkers (ADC and FA).
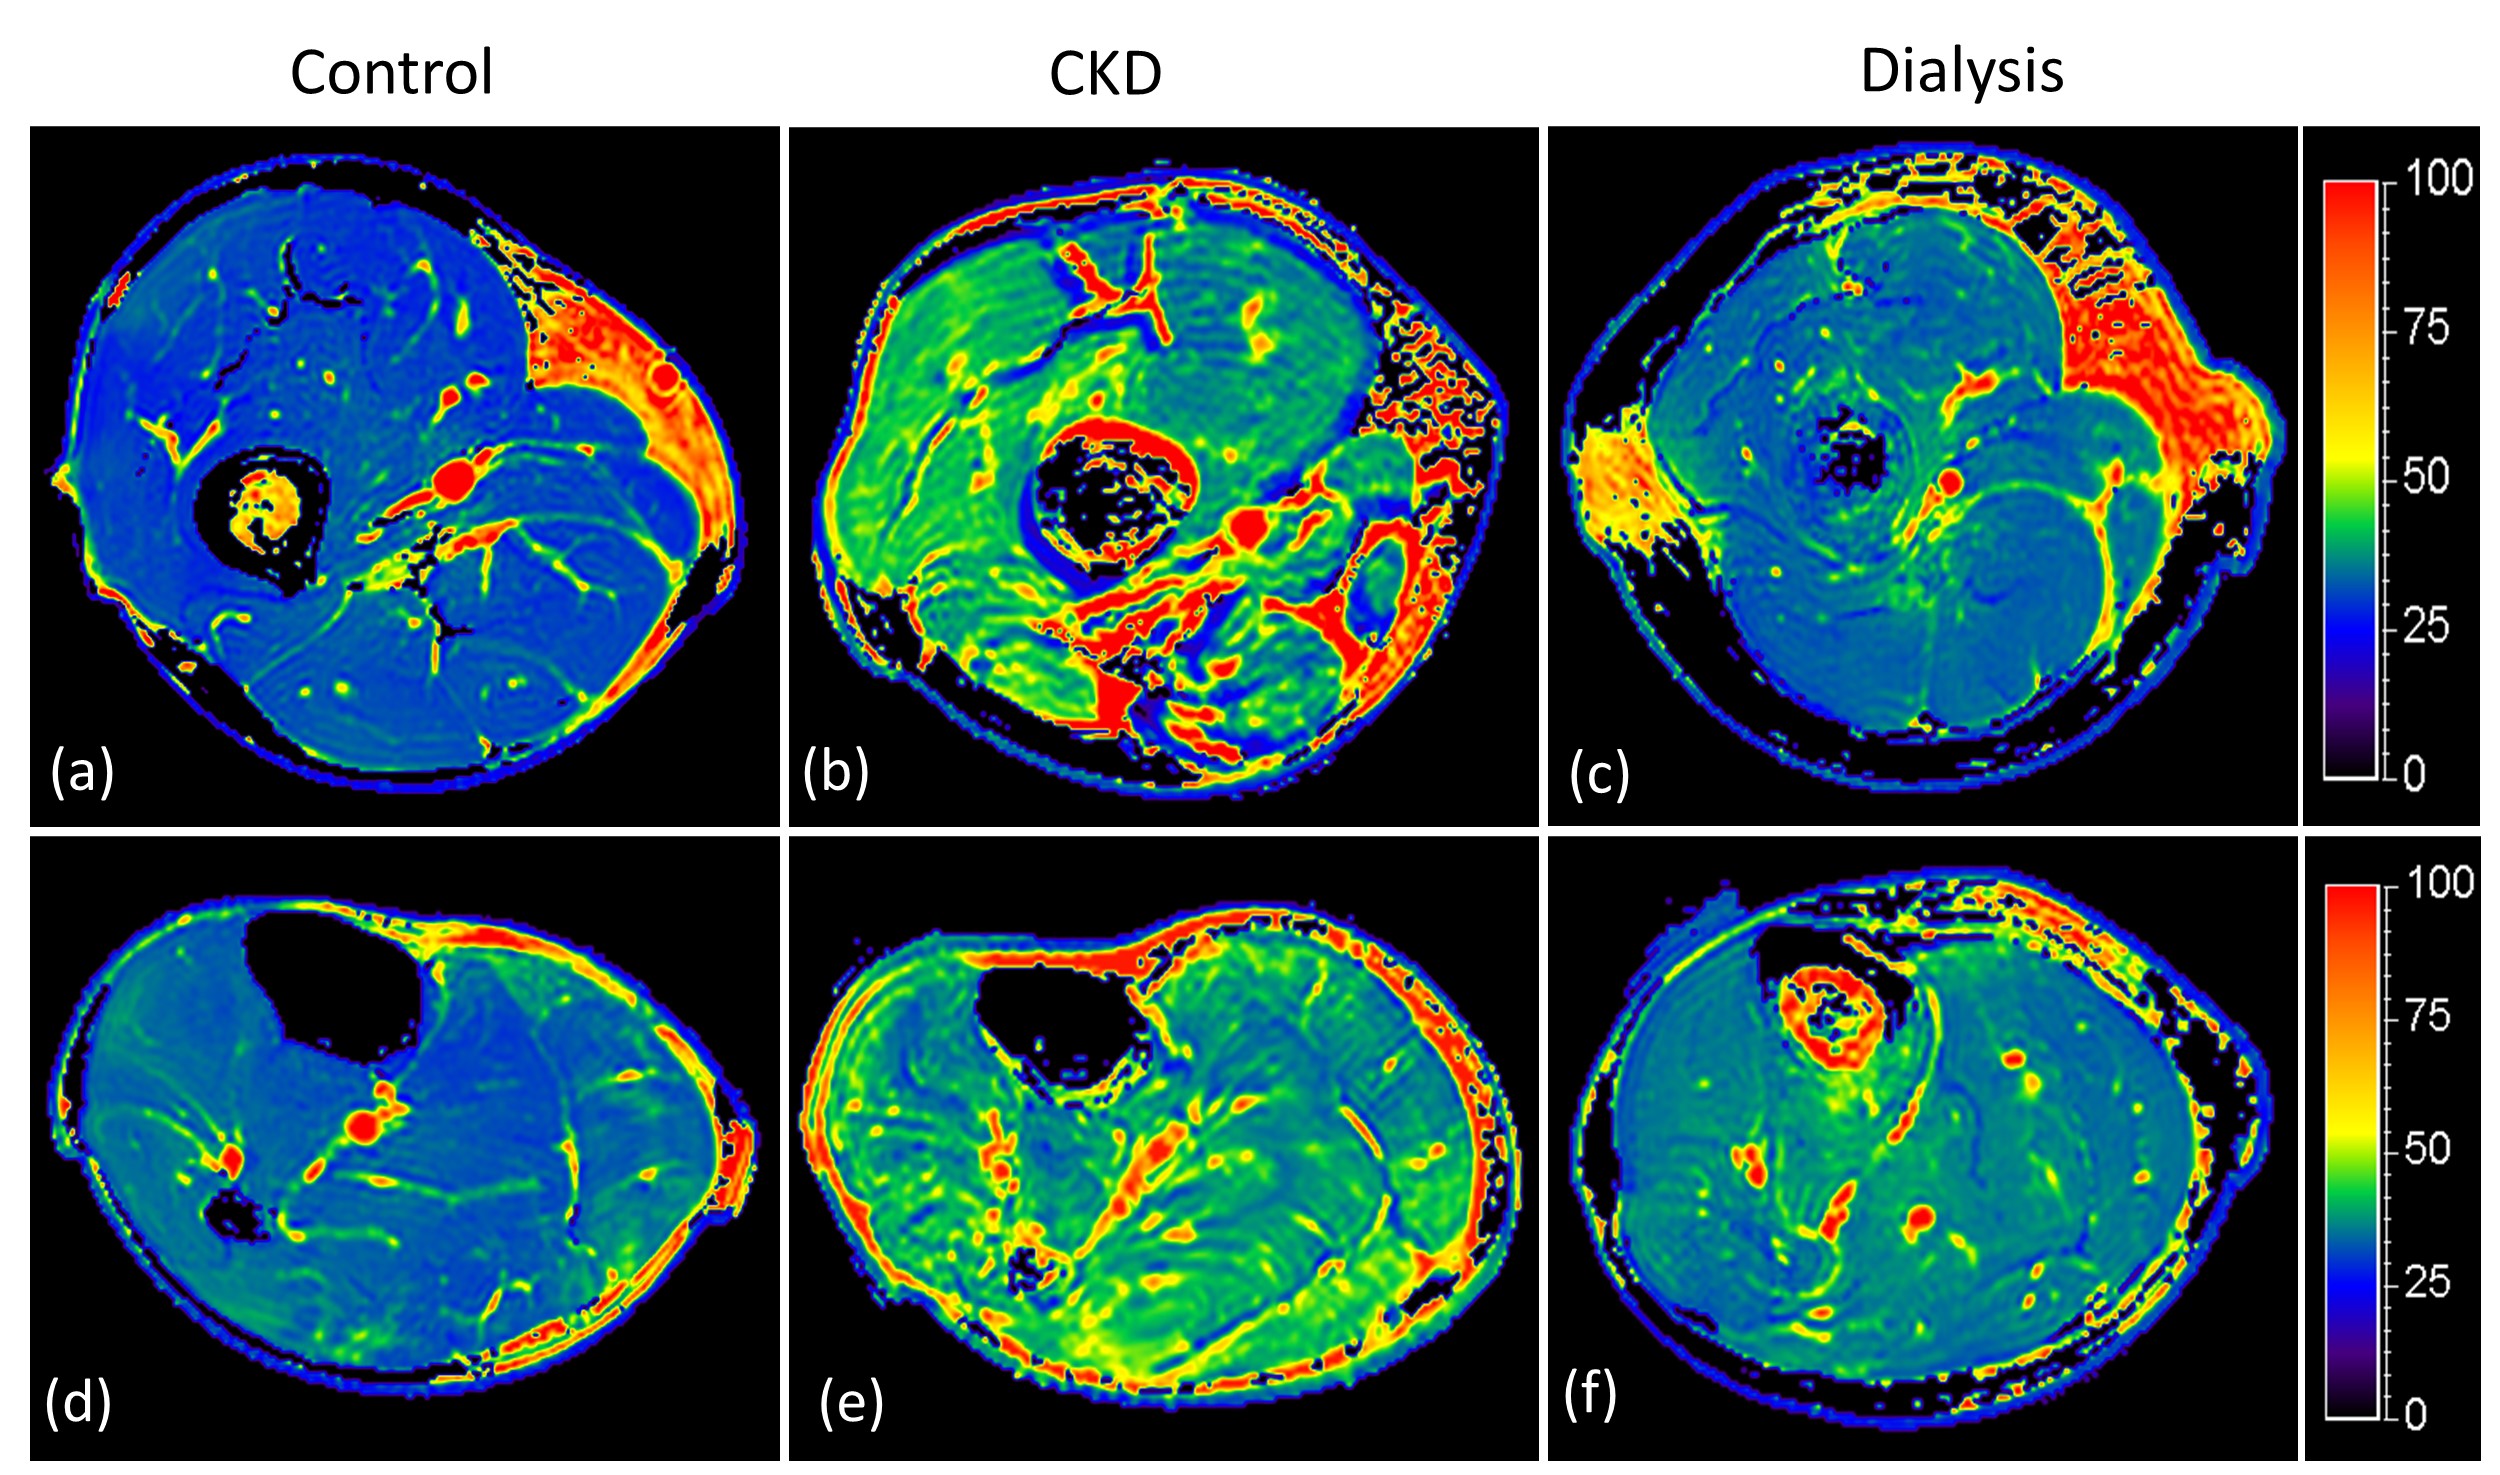
Figure 2.
T1ρ maps of skeletal muscle in a control (a, d), a patient with CKD (b, e), and a patient with dialysis (c, f). The first row shows
the thigh (a-c) and the second row shows calf (d-f). CKD: chronic kidney
disease.
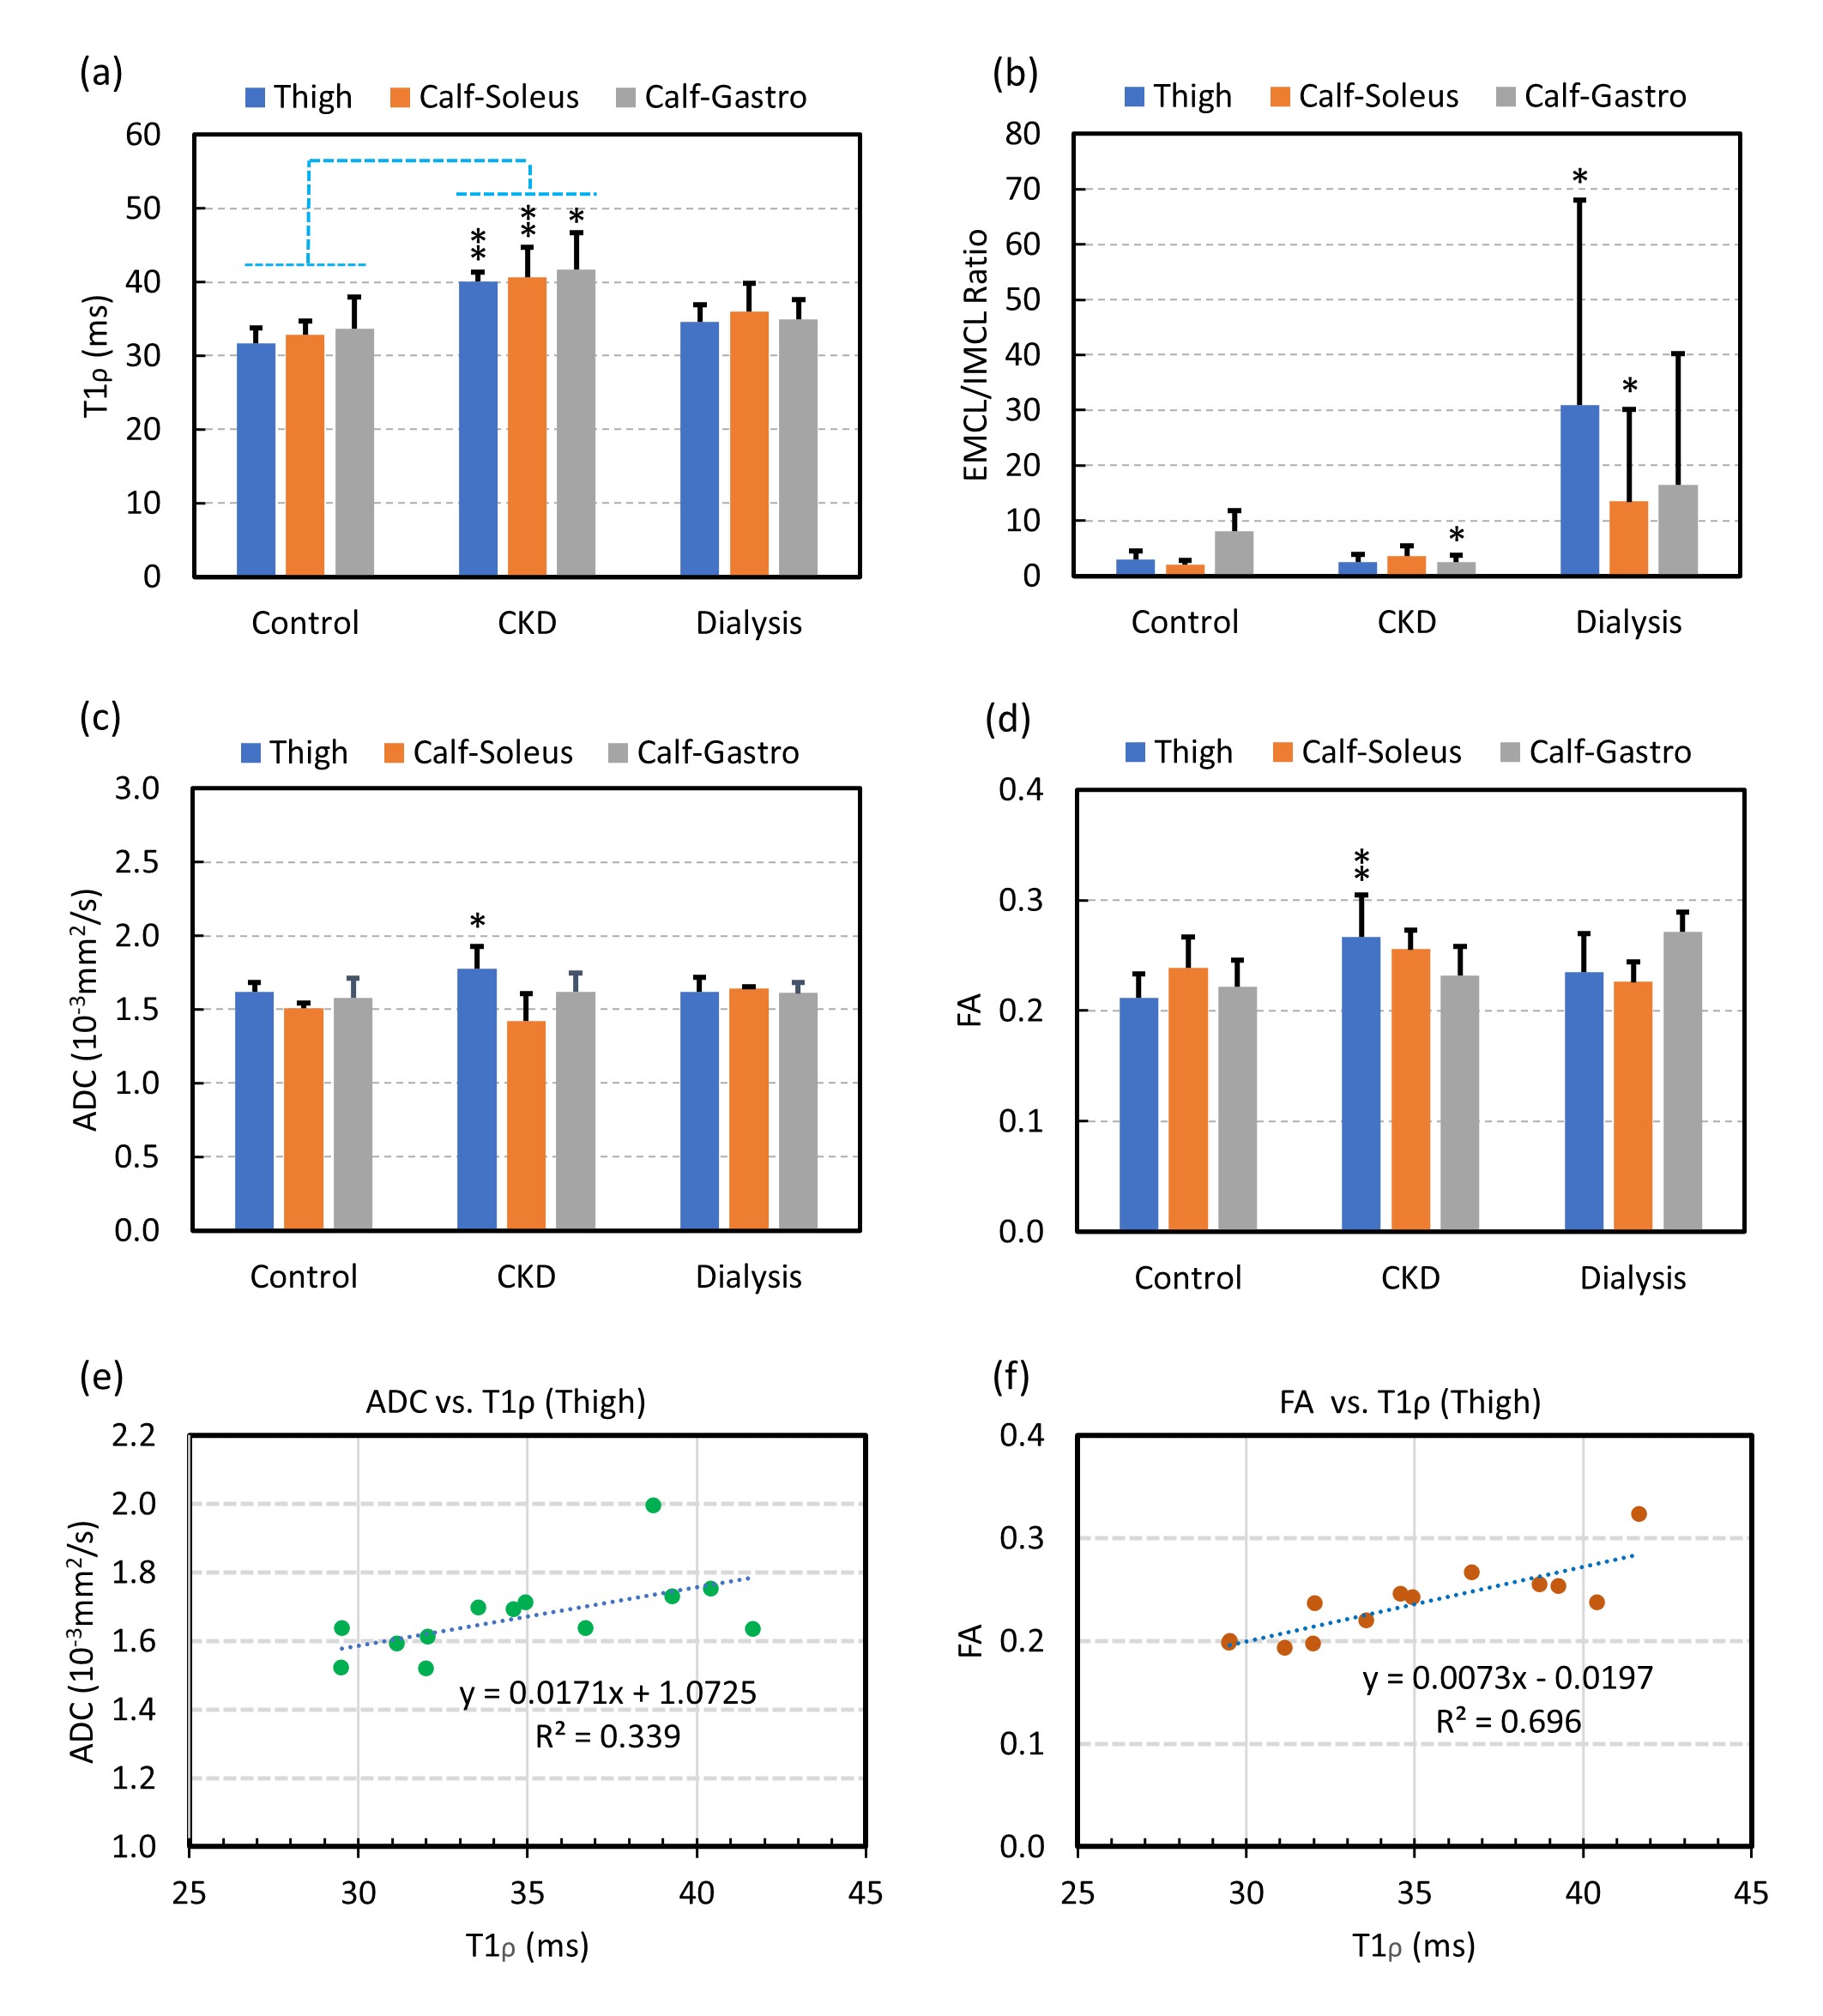
Figure 4. T1ρ, MRS and DTI assessment of skeletal muscle
function in controls, patients with CKD and dialysis. (a). T1ρ. (b). The ratio
of EMCL/IMCL. (c). Apparent diffusion coefficient (ADC). (d). Fractional
anisotropy (FA). Correlation of ADC (e) and FA (f) with T1ρ in the Thigh of all
subjects. CKD: chronic kidney disease; Gastro: gastrocnemius. EMCL/IMCL: extramyocellular/intramyocellular lipids. * and ** indicate significant difference with 0.01 < p
< 0.05 and p < 0.01, respectively, using Mann-Whitney U test.