David Mummy1, Erika Coleman2, Ziyi Wang3, Elianna Bier3, Junlan Lu4, Bastiaan Driehuys1,3,4, and Yuh-Chin Huang2
1Radiology, Duke University, Durham, NC, United States, 2Medicine, Duke University, Durham, NC, United States, 3Biomedical Engineering, Duke University, Durham, NC, United States, 4Medical Physics, Duke University, Durham, NC, United States
1Radiology, Duke University, Durham, NC, United States, 2Medicine, Duke University, Durham, NC, United States, 3Biomedical Engineering, Duke University, Durham, NC, United States, 4Medical Physics, Duke University, Durham, NC, United States
Hyperpolarized 129Xe MRI gas exchange images acquired pre/post-bronchodilator in COPD (N=17) were classified into regions of new, existing, and lost ventilation. No changes in 129Xe barrier or RBC were observed, suggesting persistent vascular abnormalities despite improved airflow.
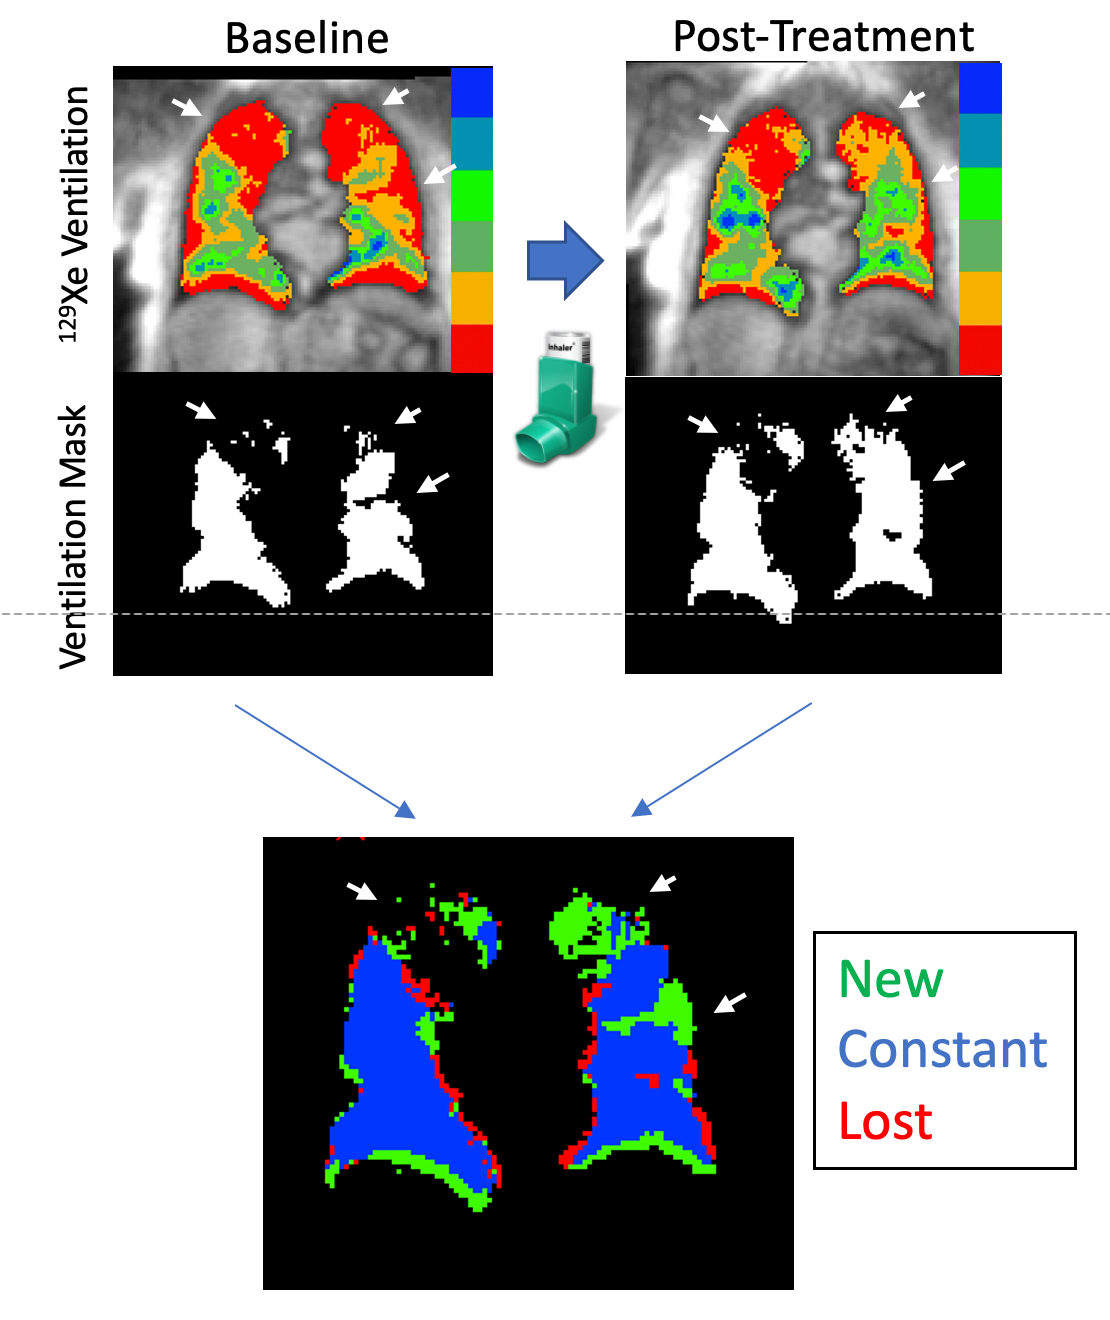
Figure 1. Derivation of revealed regions map. Baseline ventilation binning maps are binarized into ventilation masks for each timepoint (top), and then combined via image registration to classify the image into three regions: newly ventilated (green), ventilated at both time points (“constant” in blue), and regions that were ventilated at baseline but are not at follow-up (“lost”, red). Arrows indicate a prominent persistent ventilation defect in the right lung, and in the left lung, ventilation defects at baseline that are newly revealed at follow-up.
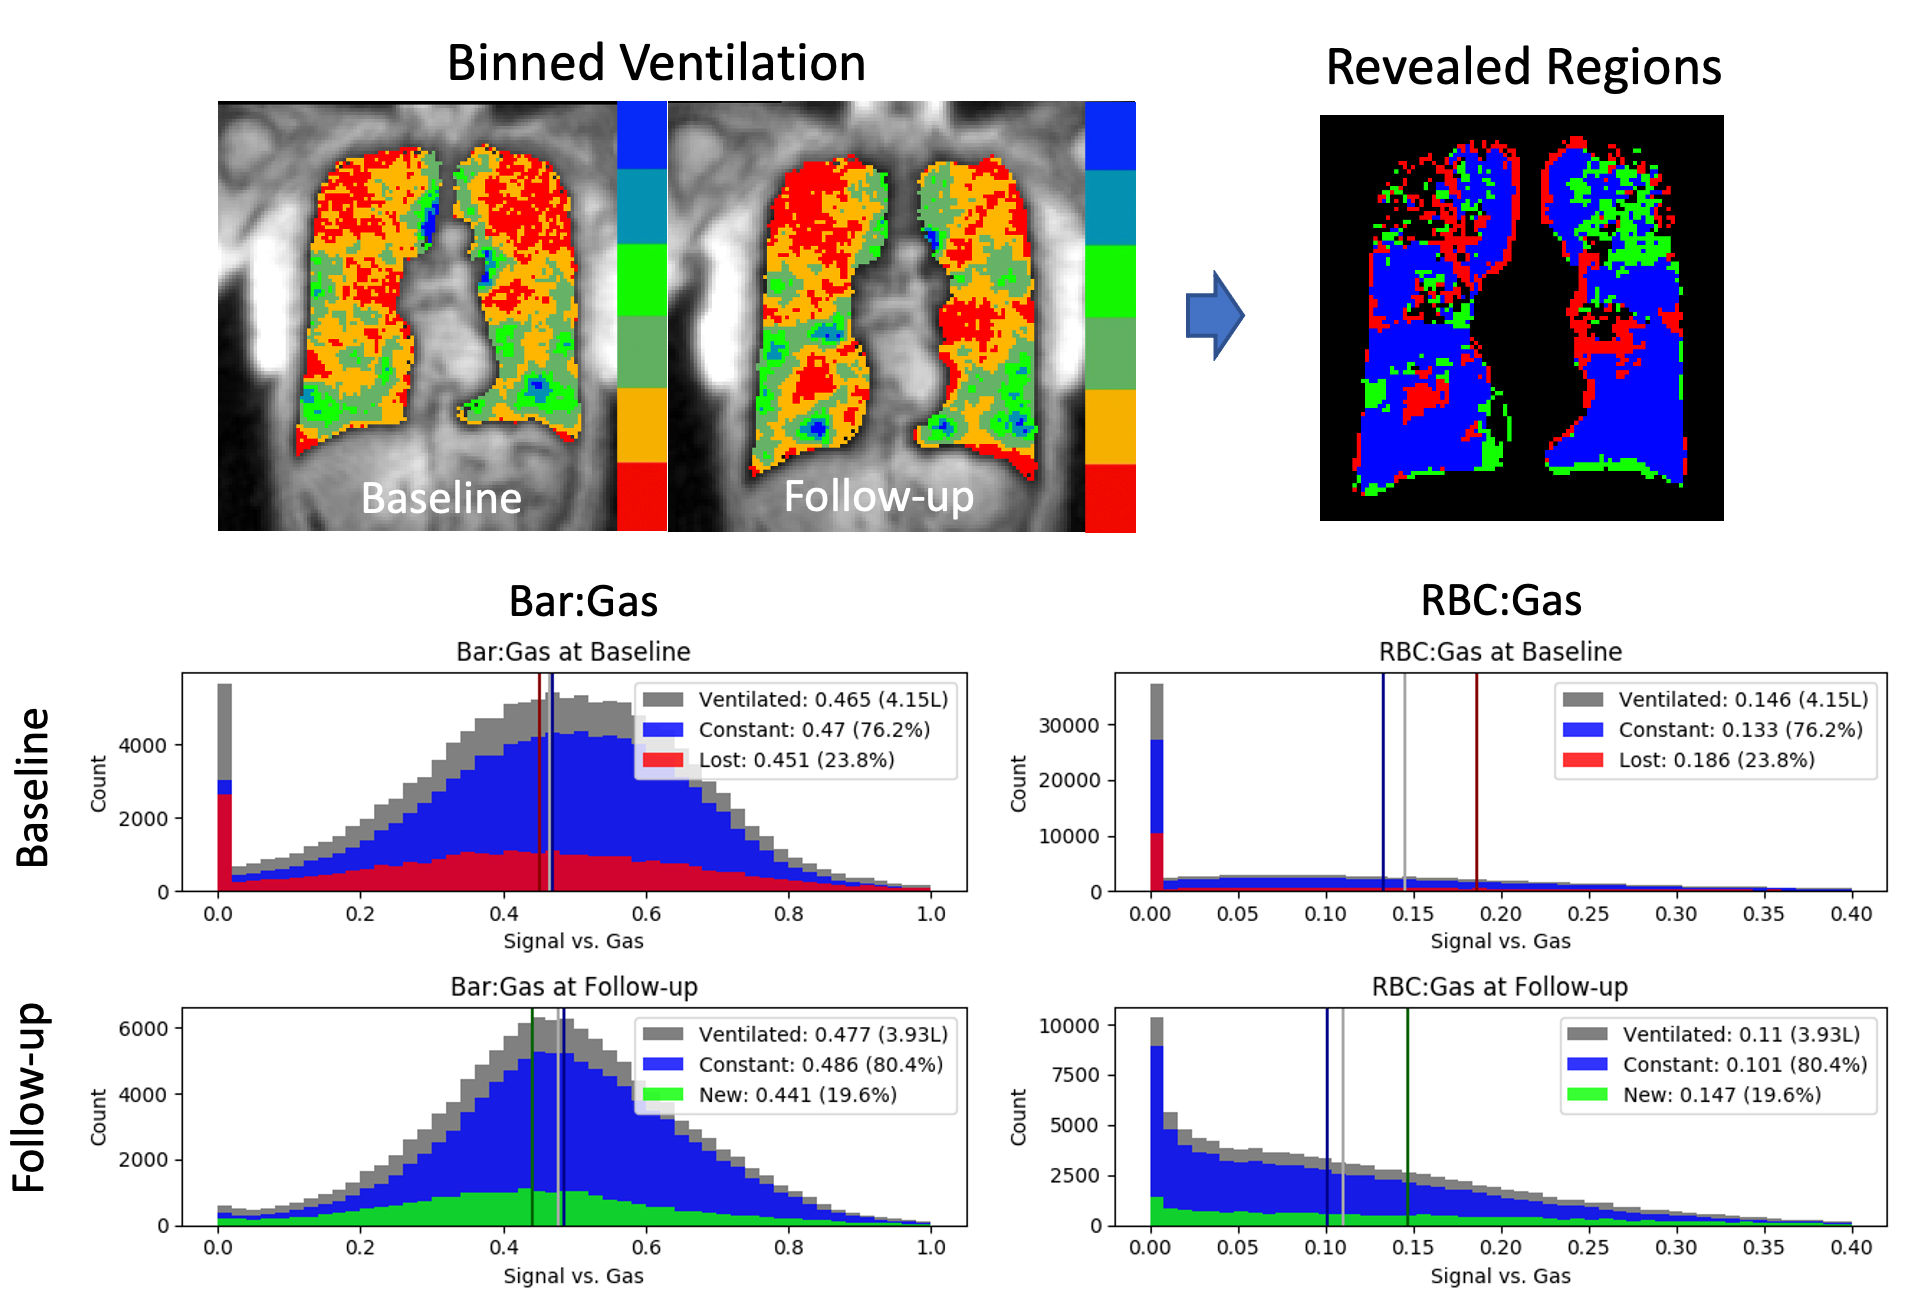
Figure 2. Example histograms corresponding to the classifications in the revealed regions map at baseline (top row) and follow-up (bottom row). Vertical bars indicate the mean value in each region. In this subject, the lost region (red) had a higher mean baseline RBC:Gas ratio than both the constant region (blue) or the overall ventilated volume (gray). At follow-up, the newly revealed regions (green) had a higher mean RBC:Gas ratio than the constant region, but the RBC:Gas ratio of the overall ventilated lung still dropped from 0.15 to 0.11.