Raphael Tomi-Tricot1,2,3, Jan Sedlacik2,3, Jonathan Endres4, Juergen Herrler5, Patrick Liebig6, Rene Gumbrecht6, Dieter Ritter6, Tom Wilkinson2,3, Pip Bridgen7, Sharon Giles7, Armin M. Nagel4, Joseph V. Hajnal2,3, Radhouene Neji1,2, and Shaihan J. Malik2,3
1MR Research Collaborations, Siemens Healthcare Limited, Frimley, United Kingdom, 2Biomedical Engineering Department, School of Biomedical Engineering and Imaging Sciences, King's College London, London, United Kingdom, 3Centre for the Developing Brain, School of Biomedical Engineering and Imaging Sciences, King's College London, London, United Kingdom, 4Institute of Radiology, University Hospital Erlangen, Erlangen, Germany, 5Institute of Neuroradiology, University Hospital Erlangen, Erlangen, Germany, 6Siemens Healthcare GmbH, Erlangen, Germany, 7School of Biomedical Engineering and Imaging Sciences, King's College London, London, United Kingdom
1MR Research Collaborations, Siemens Healthcare Limited, Frimley, United Kingdom, 2Biomedical Engineering Department, School of Biomedical Engineering and Imaging Sciences, King's College London, London, United Kingdom, 3Centre for the Developing Brain, School of Biomedical Engineering and Imaging Sciences, King's College London, London, United Kingdom, 4Institute of Radiology, University Hospital Erlangen, Erlangen, Germany, 5Institute of Neuroradiology, University Hospital Erlangen, Erlangen, Germany, 6Siemens Healthcare GmbH, Erlangen, Germany, 7School of Biomedical Engineering and Imaging Sciences, King's College London, London, United Kingdom
Direct Signal Control was successfully applied in the brain
at 7T in routine conditions and without manual intervention. It consistently
achieved higher and more homogeneous signal in T2-weighted FSE sequences, under
strict SAR limits.
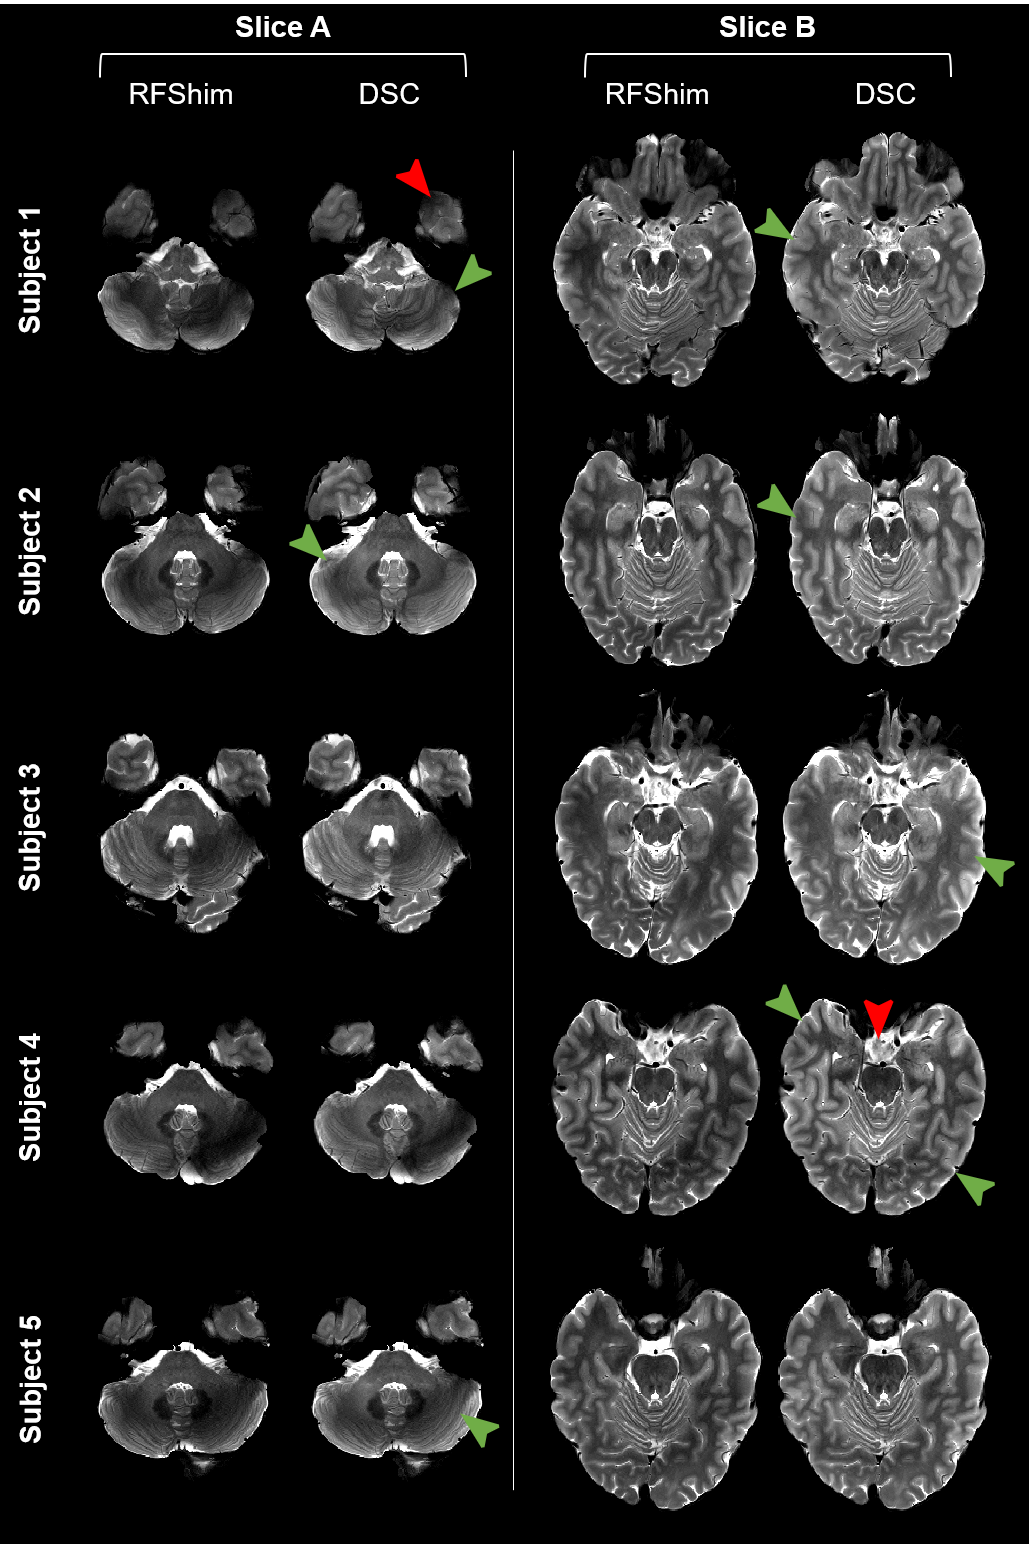
Figure 4: For each subject (rows), comparison
of images acquired with static RF shimming (RFShim) and direct signal control
(DSC) in two representative slices (groups A and B). DSC shows improved signal
homogeneity compared to RFShim in cerebellum and lower brain cortex. Arrowheads
point at some areas of interest (DSC gain in green, loss in red).
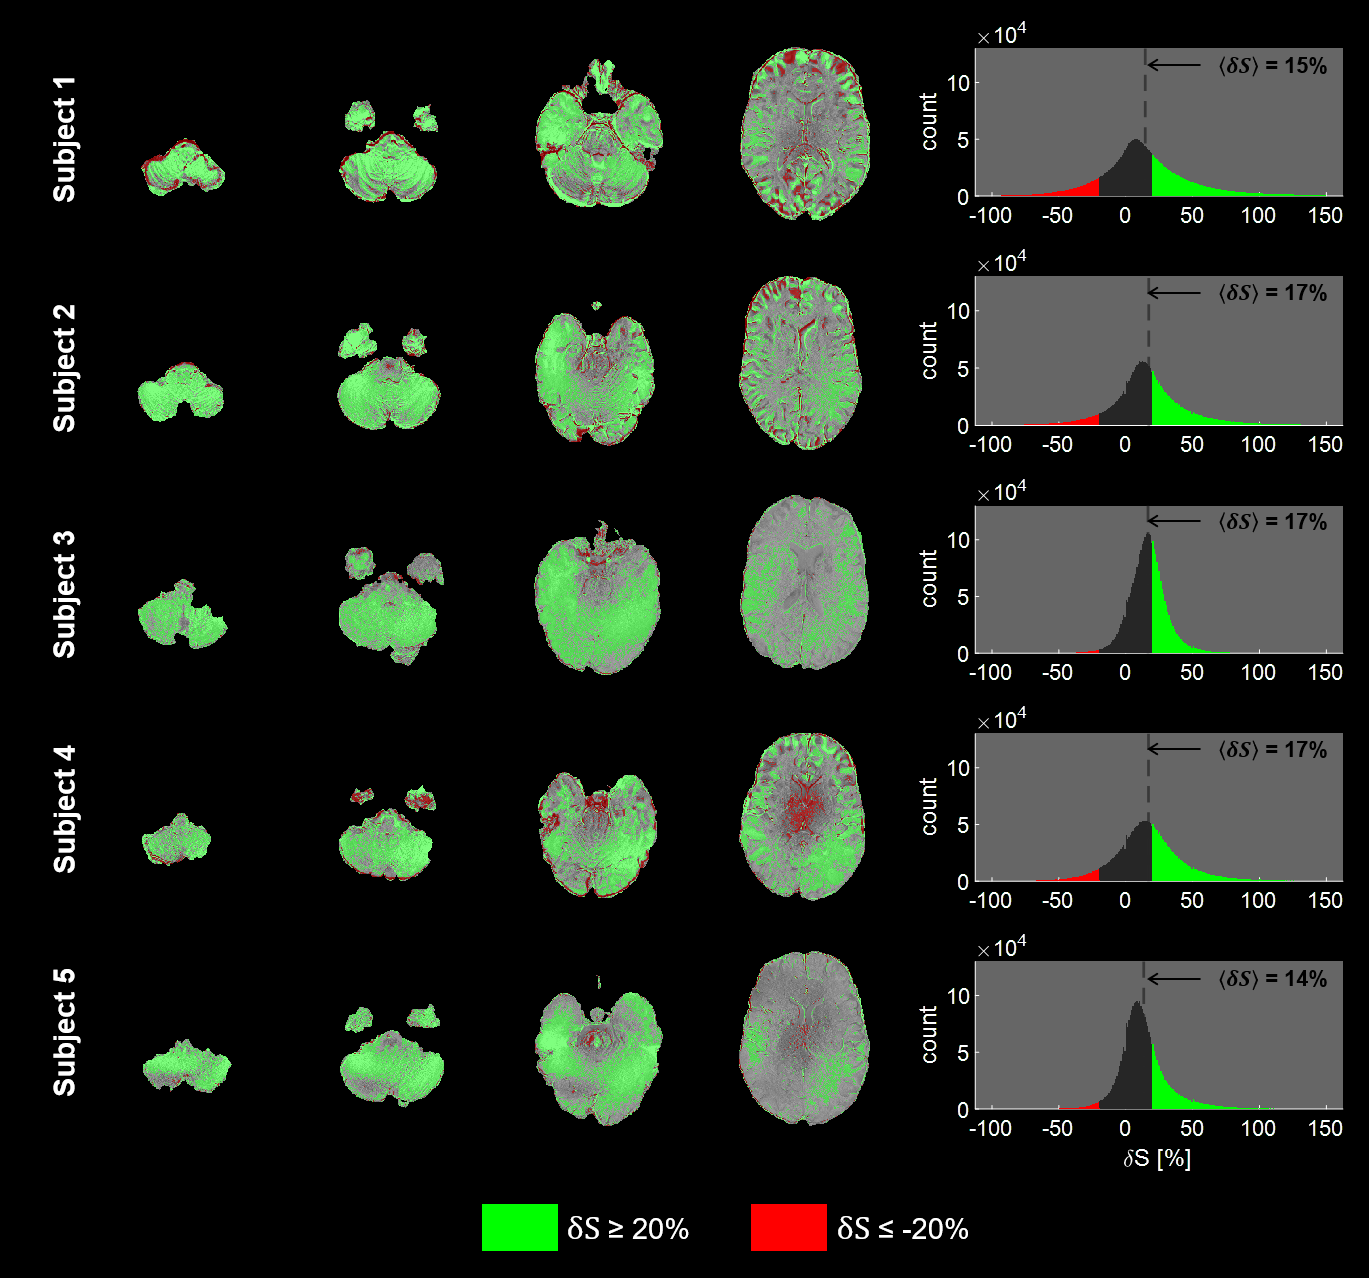
Figure 5: For each subject, maps of relative
signal difference ($$$\delta{S}$$$) between RFShim and DSC on four representative slices, and histogram of $$$\delta{S}$$$ on the whole brain. Regions
exhibiting signal differences beyond +20% (resp. -20%) are highlighted in
green (resp. red). Only in Subject 4 signal loss is observed in central brain
despite B1+ correction; other regions see a net signal
gain with DSC . Average $$$\delta{S}$$$ is reported on histograms. Also note the agreement with the last row of Figure
3 (Subject 3).