Jacob-Jan Sloots1, Martijn Froeling1, Geert Jan Biessels2, and Jaco Zwanenburg1
1Radiology, University Medical Center Utrecht, Utrecht, Netherlands, 2Neurology, University Medical Center Utrecht, Utrecht, Netherlands
1Radiology, University Medical Center Utrecht, Utrecht, Netherlands, 2Neurology, University Medical Center Utrecht, Utrecht, Netherlands
Simultaneous
measurement of brain tissue diffusion and strain over the cardiac cycle,
together with a theoretical analysis shows that diffusion fluctuation cannot be
explained by strain-induced measurement errors, but probably reflects
physiology.
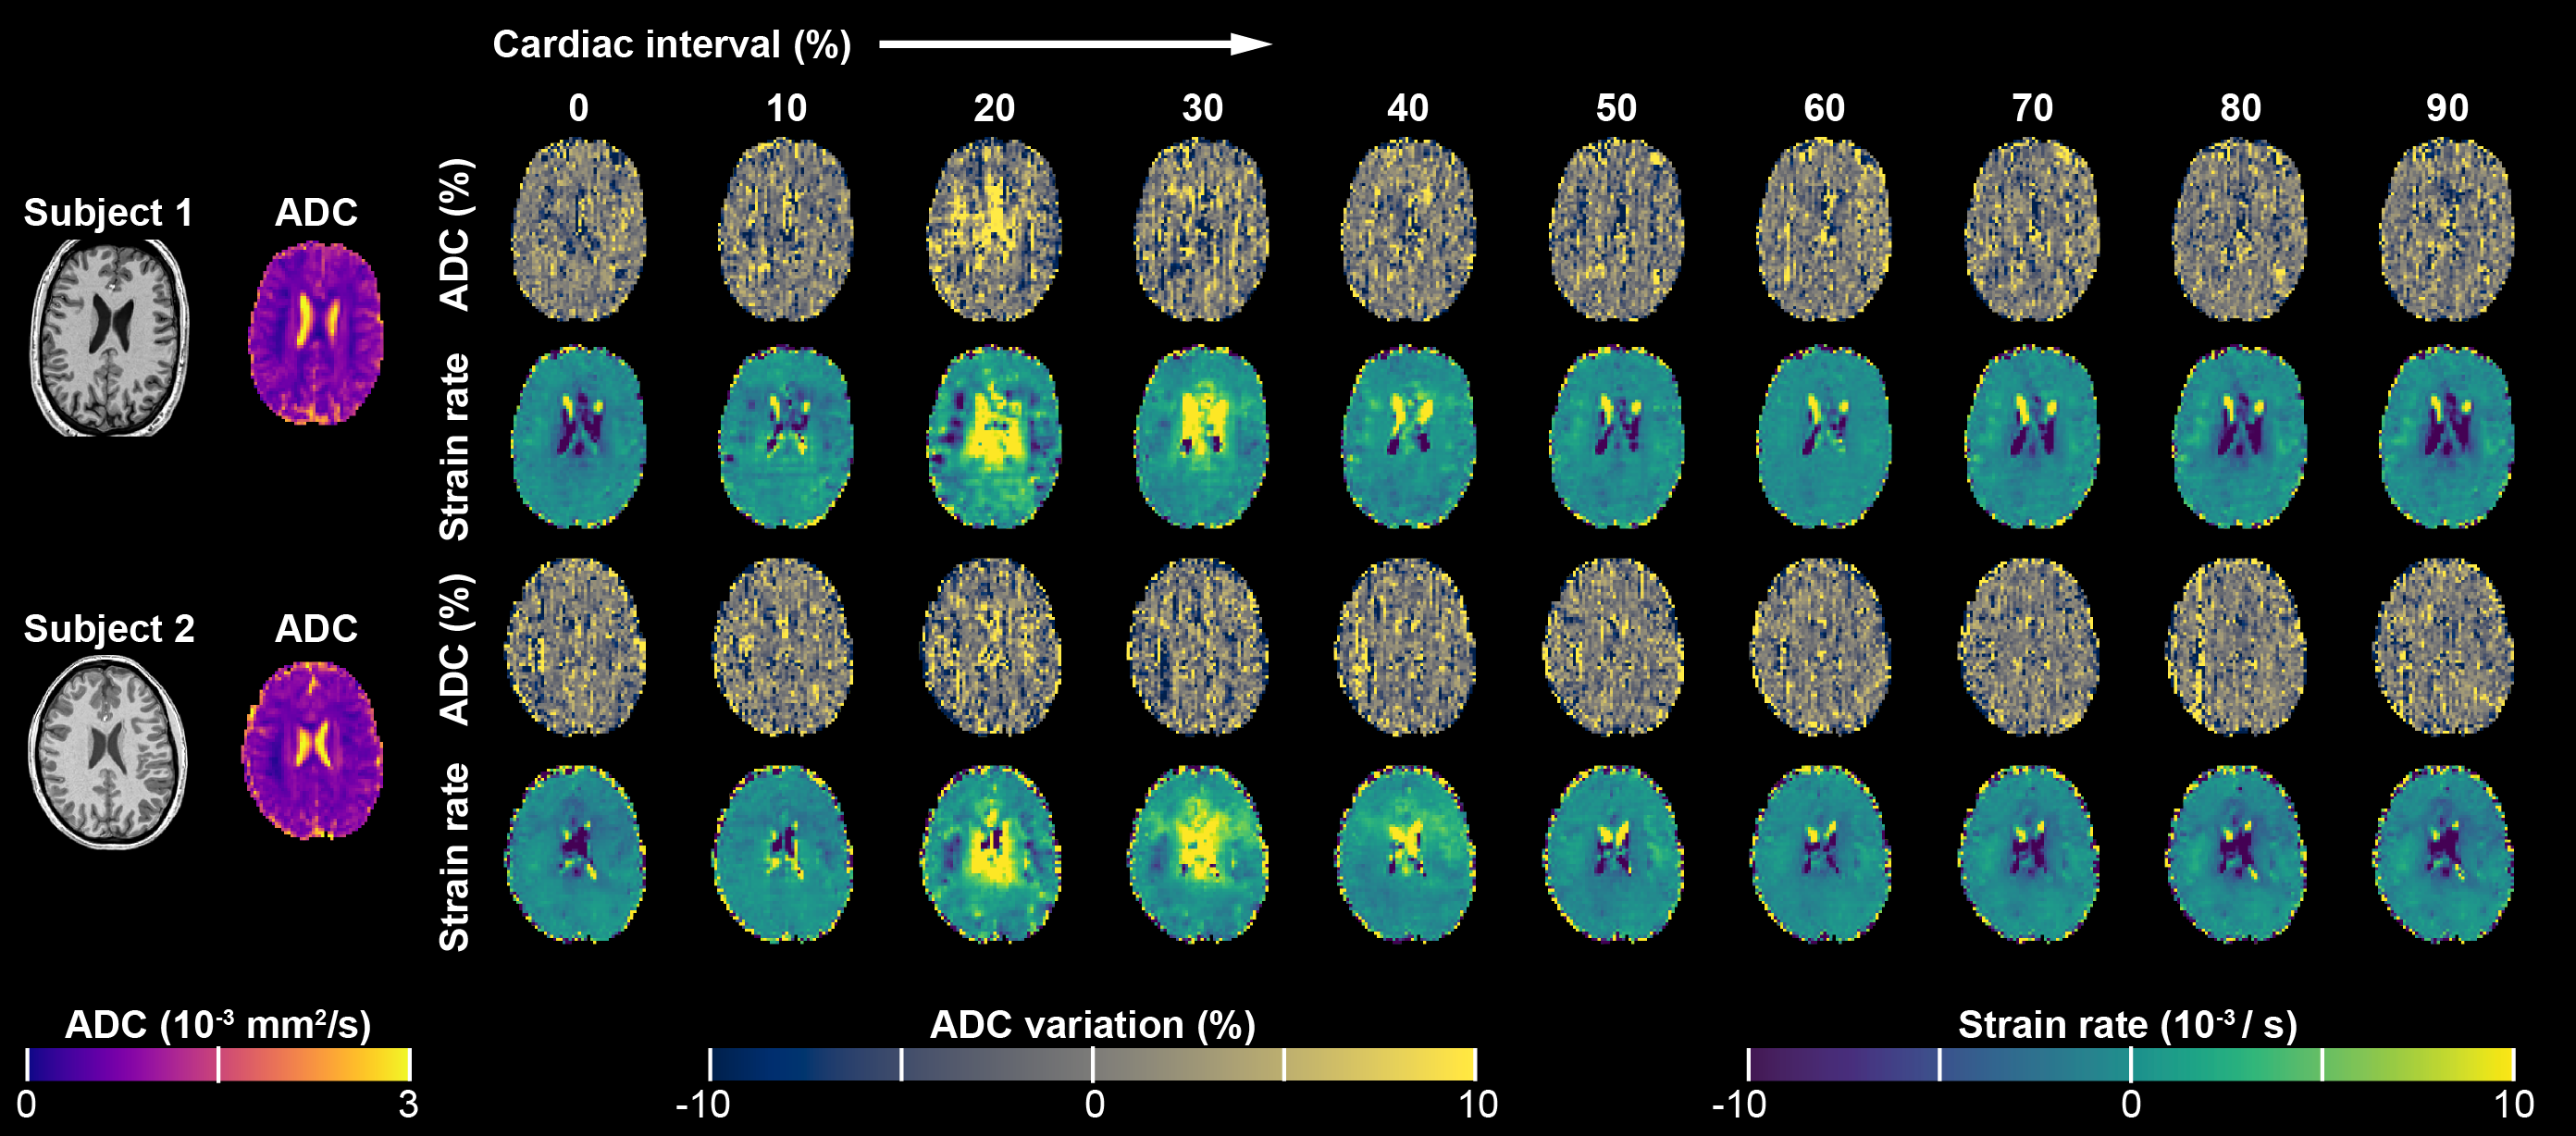
ADC and strain-rate maps over the cardiac cycle
for two subjects. Although slices were acquired with sagittal orientation and
FH encoding, we present the fitted images for a transverse orientation. On the
left, the T1-weighted image and the average ADC map are shown. Ten cardiac
phases were reconstructed; the upper represents the relative difference of ADC
over the cardiac cycle, the lower row represents the strain rates. Largest
change was observed at peak systole (20-30% cardiac interval).
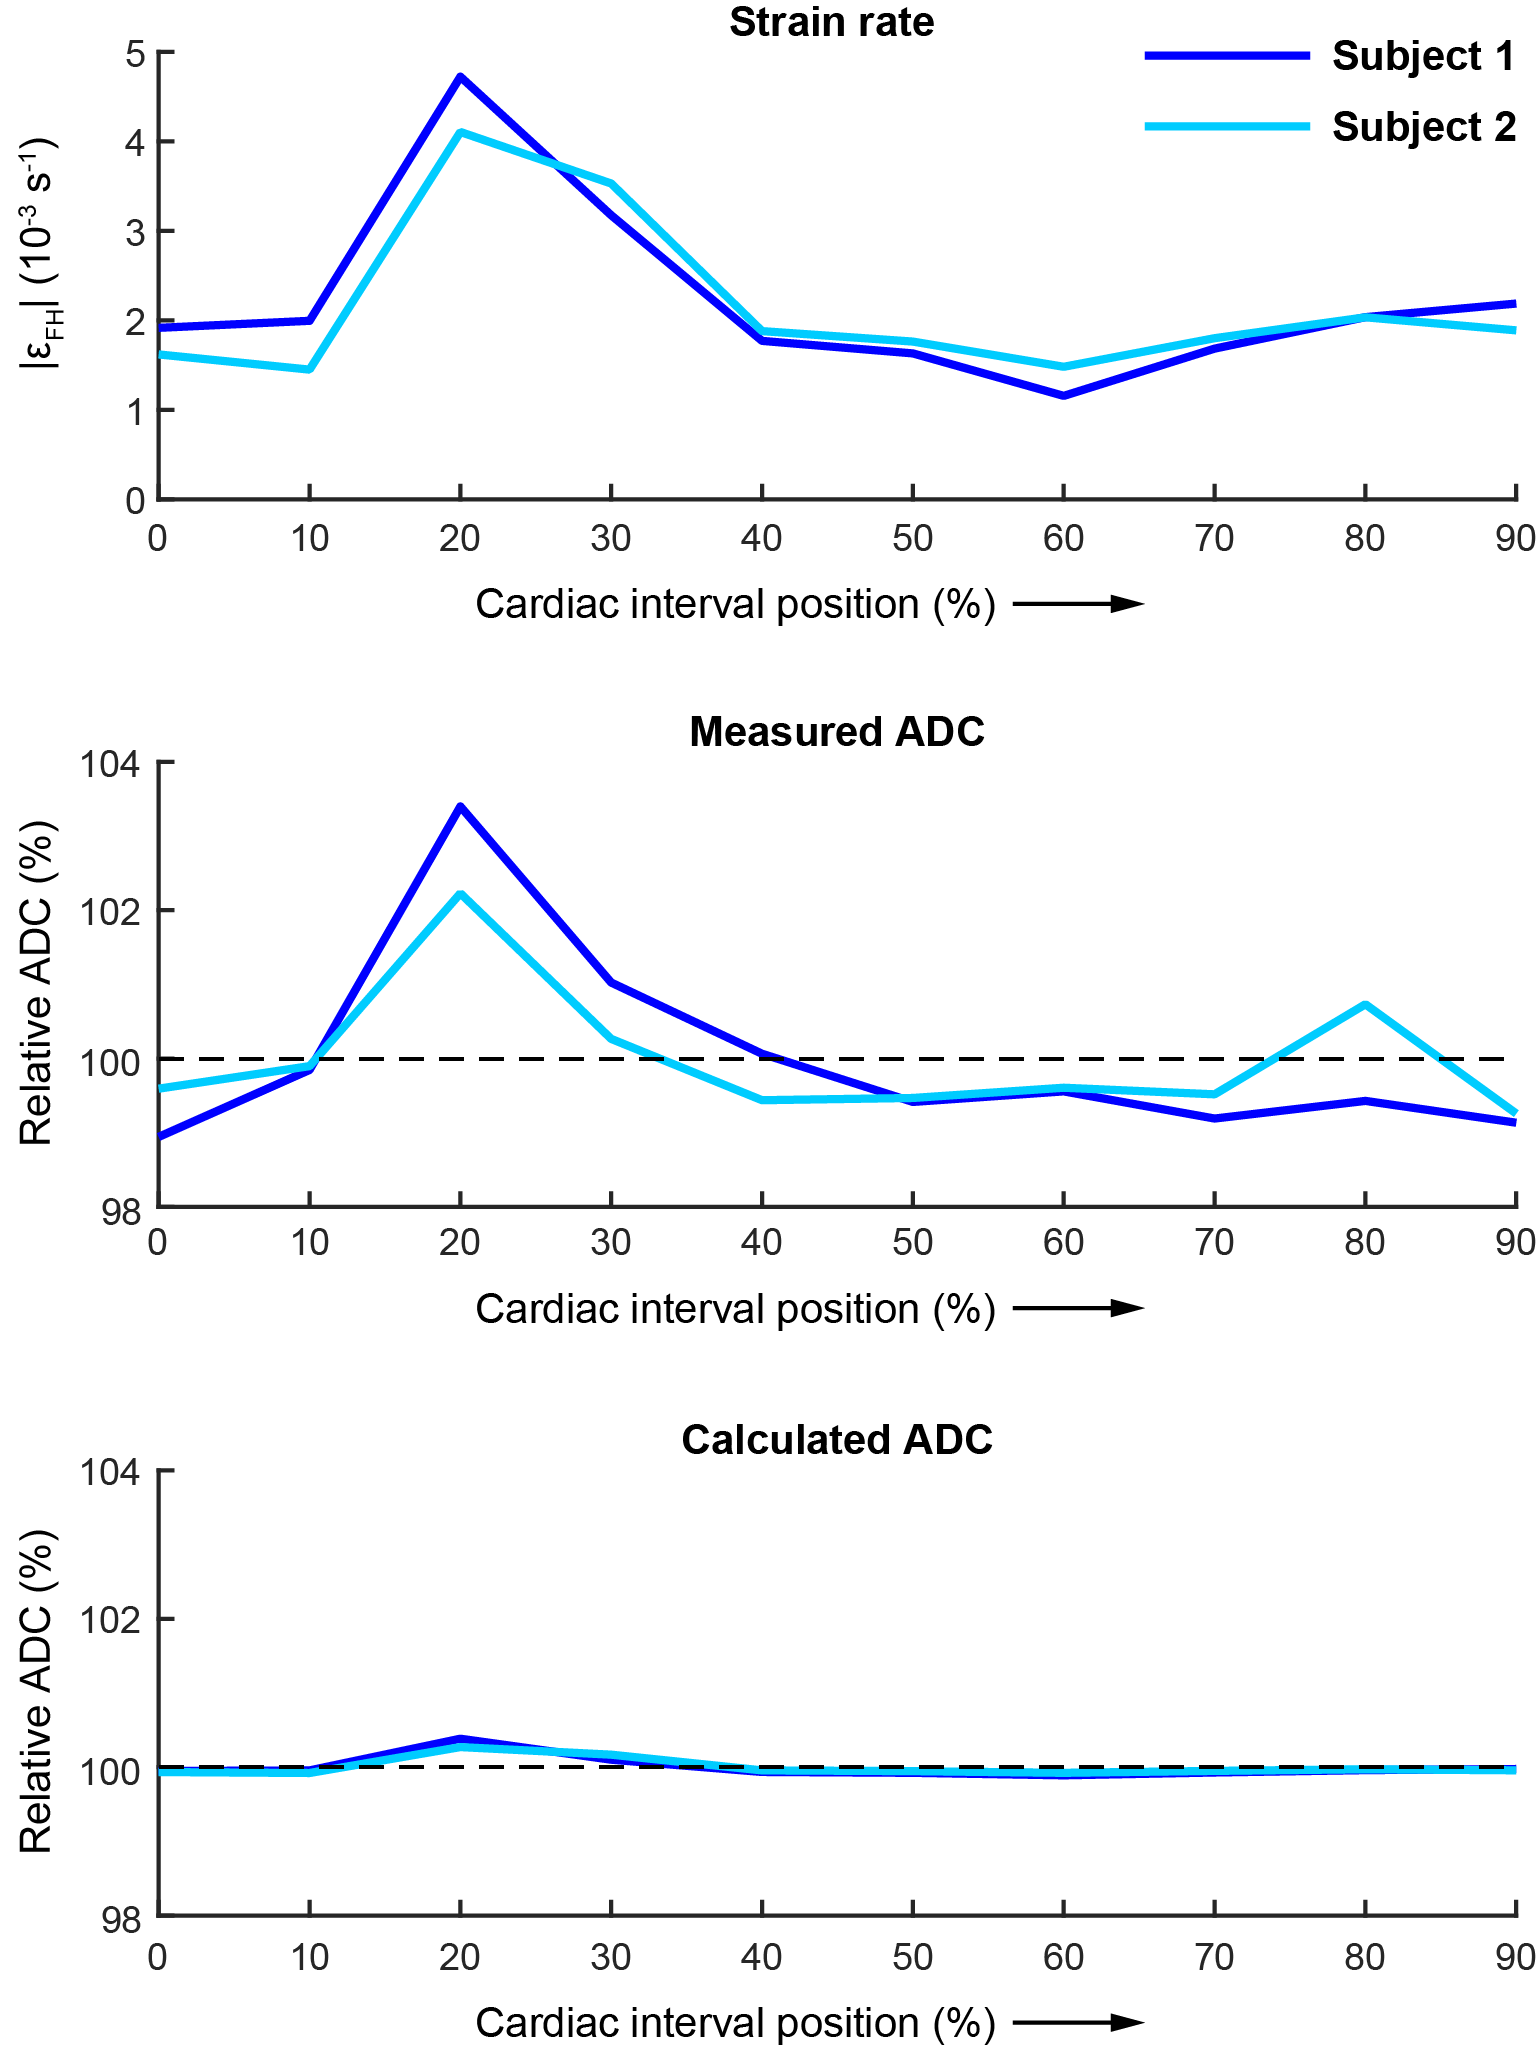
Relation
between ADC and strain rate over the cardiac cycle, averaged over the conservative
white matter mask, avoiding
blood and CSF signals. Top: strain-rate (absolute values, used to avoid cancellation
from averaging). Middle: measured ADC as percentage of the average ADC. Bottom:
calculated ADC fluctuation, based on negative strain only (representing the
‘worst’ case). Negative strain was obtained by multiplying absolute strain-rate
(top trace) by -1 times the mixing time (100ms).