Jan Valošek1,2 and Julien Cohen-Adad2,3
1Department of Neurology, Faculty of Medicine and Dentistry, Palacký University Olomouc, Olomouc, Czech Republic, 2NeuroPoly Lab, Institute of Biomedical Engineering, Polytechnique Montreal, Montreal, QC, Canada, 3Functional Neuroimaging Unit, CRIUGM, University of Montreal, Montreal, QC, Canada
1Department of Neurology, Faculty of Medicine and Dentistry, Palacký University Olomouc, Olomouc, Czech Republic, 2NeuroPoly Lab, Institute of Biomedical Engineering, Polytechnique Montreal, Montreal, QC, Canada, 3Functional Neuroimaging Unit, CRIUGM, University of Montreal, Montreal, QC, Canada
We established normative qMRI metrics along C2-C5 cervical spinal cord levels for different regions-of-interest (spinal cord, white and gray matter, white matter columns) for 3 major MRI vendors (Siemens, Philips, GE) in ~250 healthy subjects.
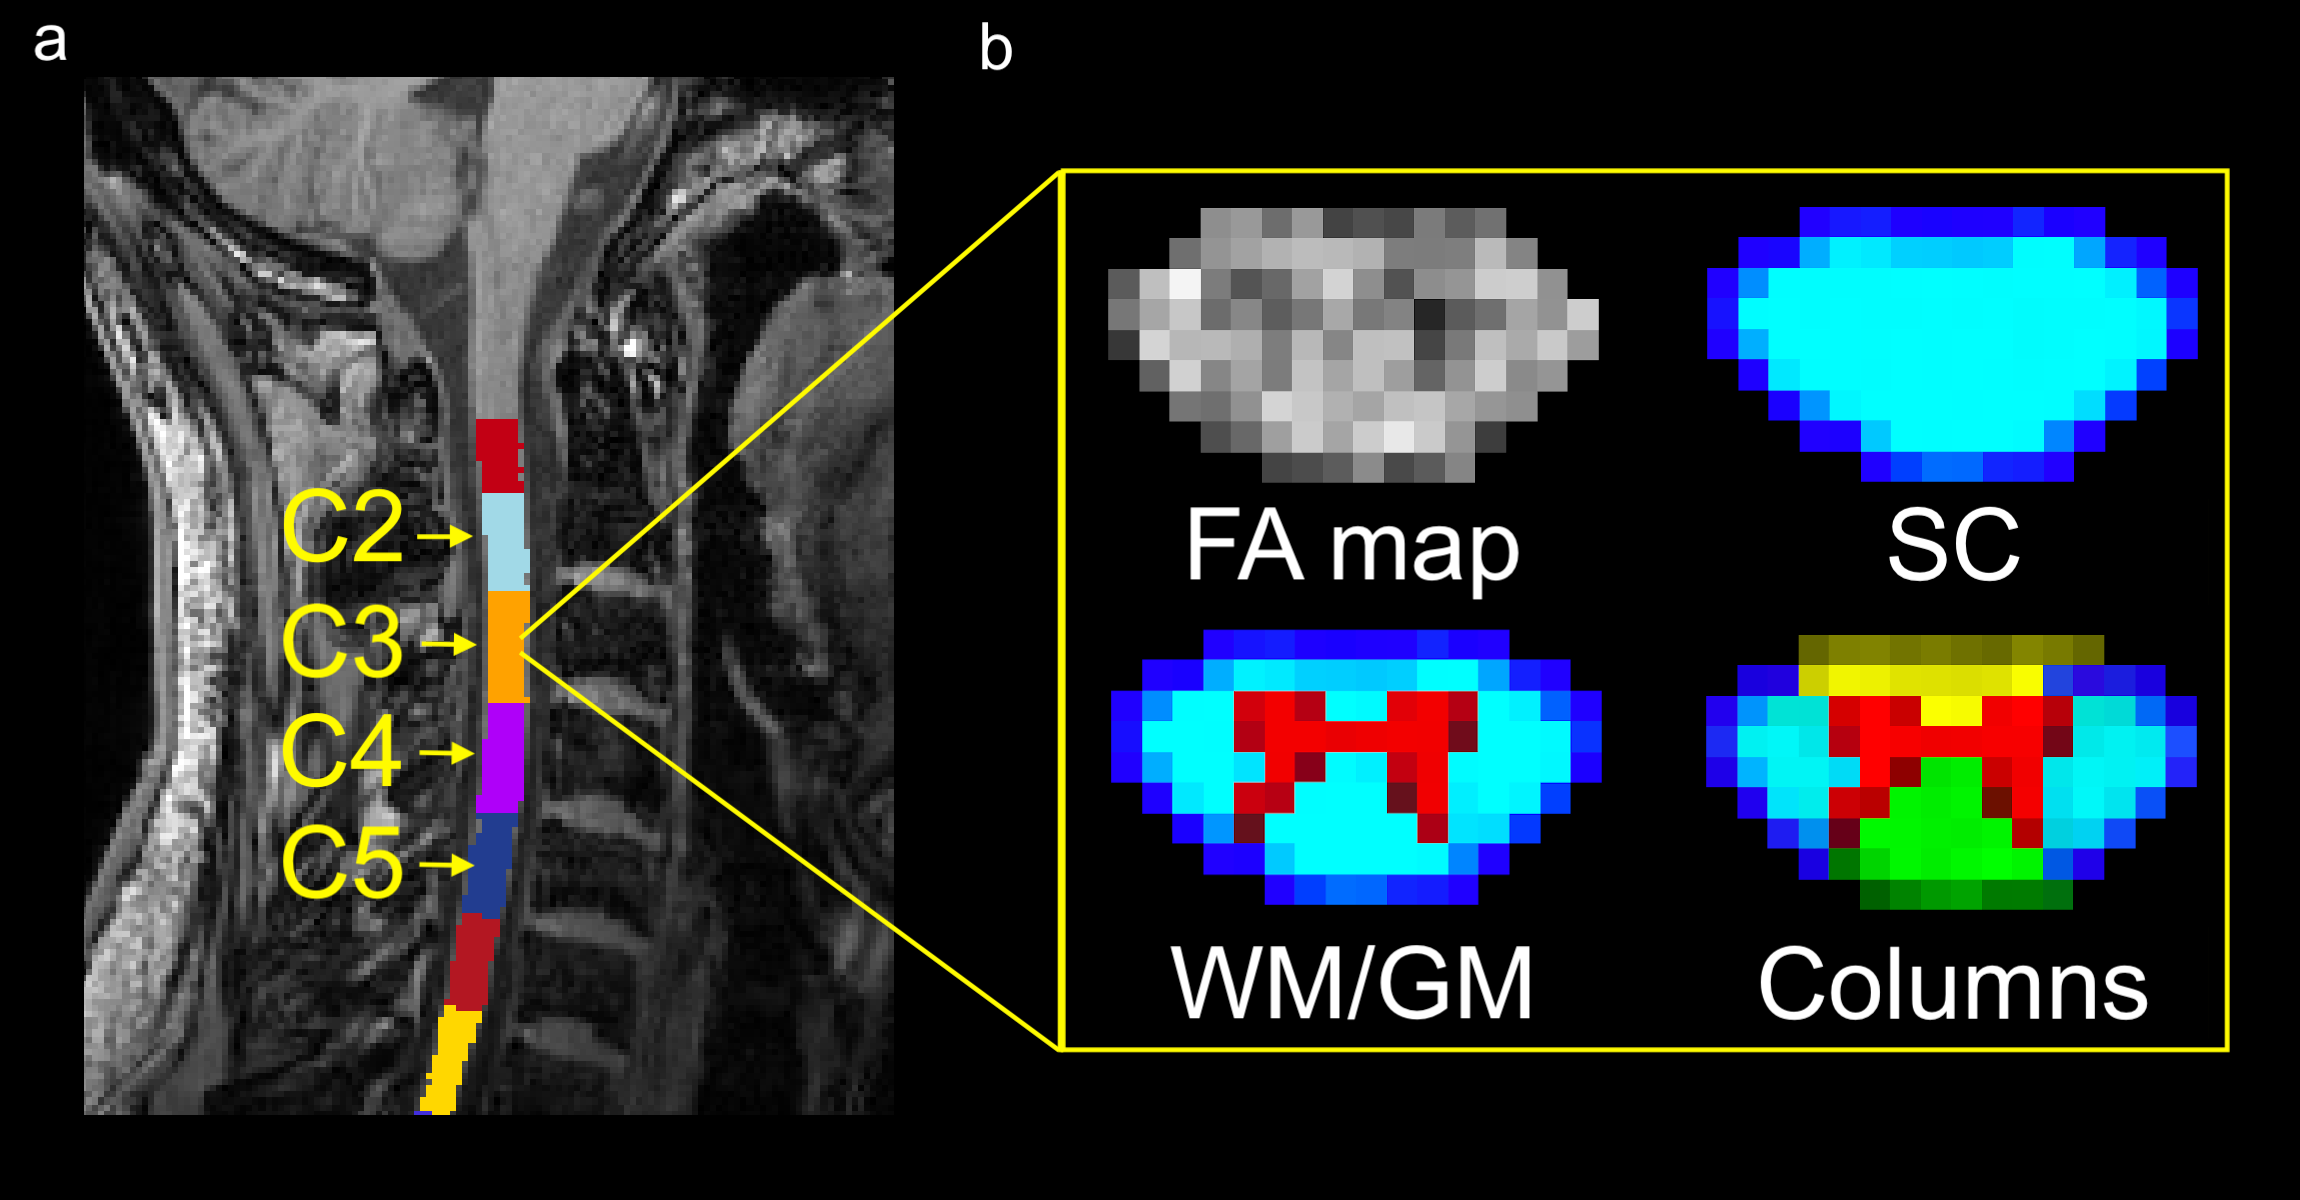
Figure 1: (a) Example of used vertebral levels from C2 to C5 on structural T1-w image and (b) example of FA map from C3 level with illustration of individual regions-of-interest defined based on probabilistic PAM50 atlas. Light blue - spinal cord (SC), red/light blue - gray matter (GM) and white matter (WM), yellow - ventral columns, light blue - lateral columns, green - dorsal columns.
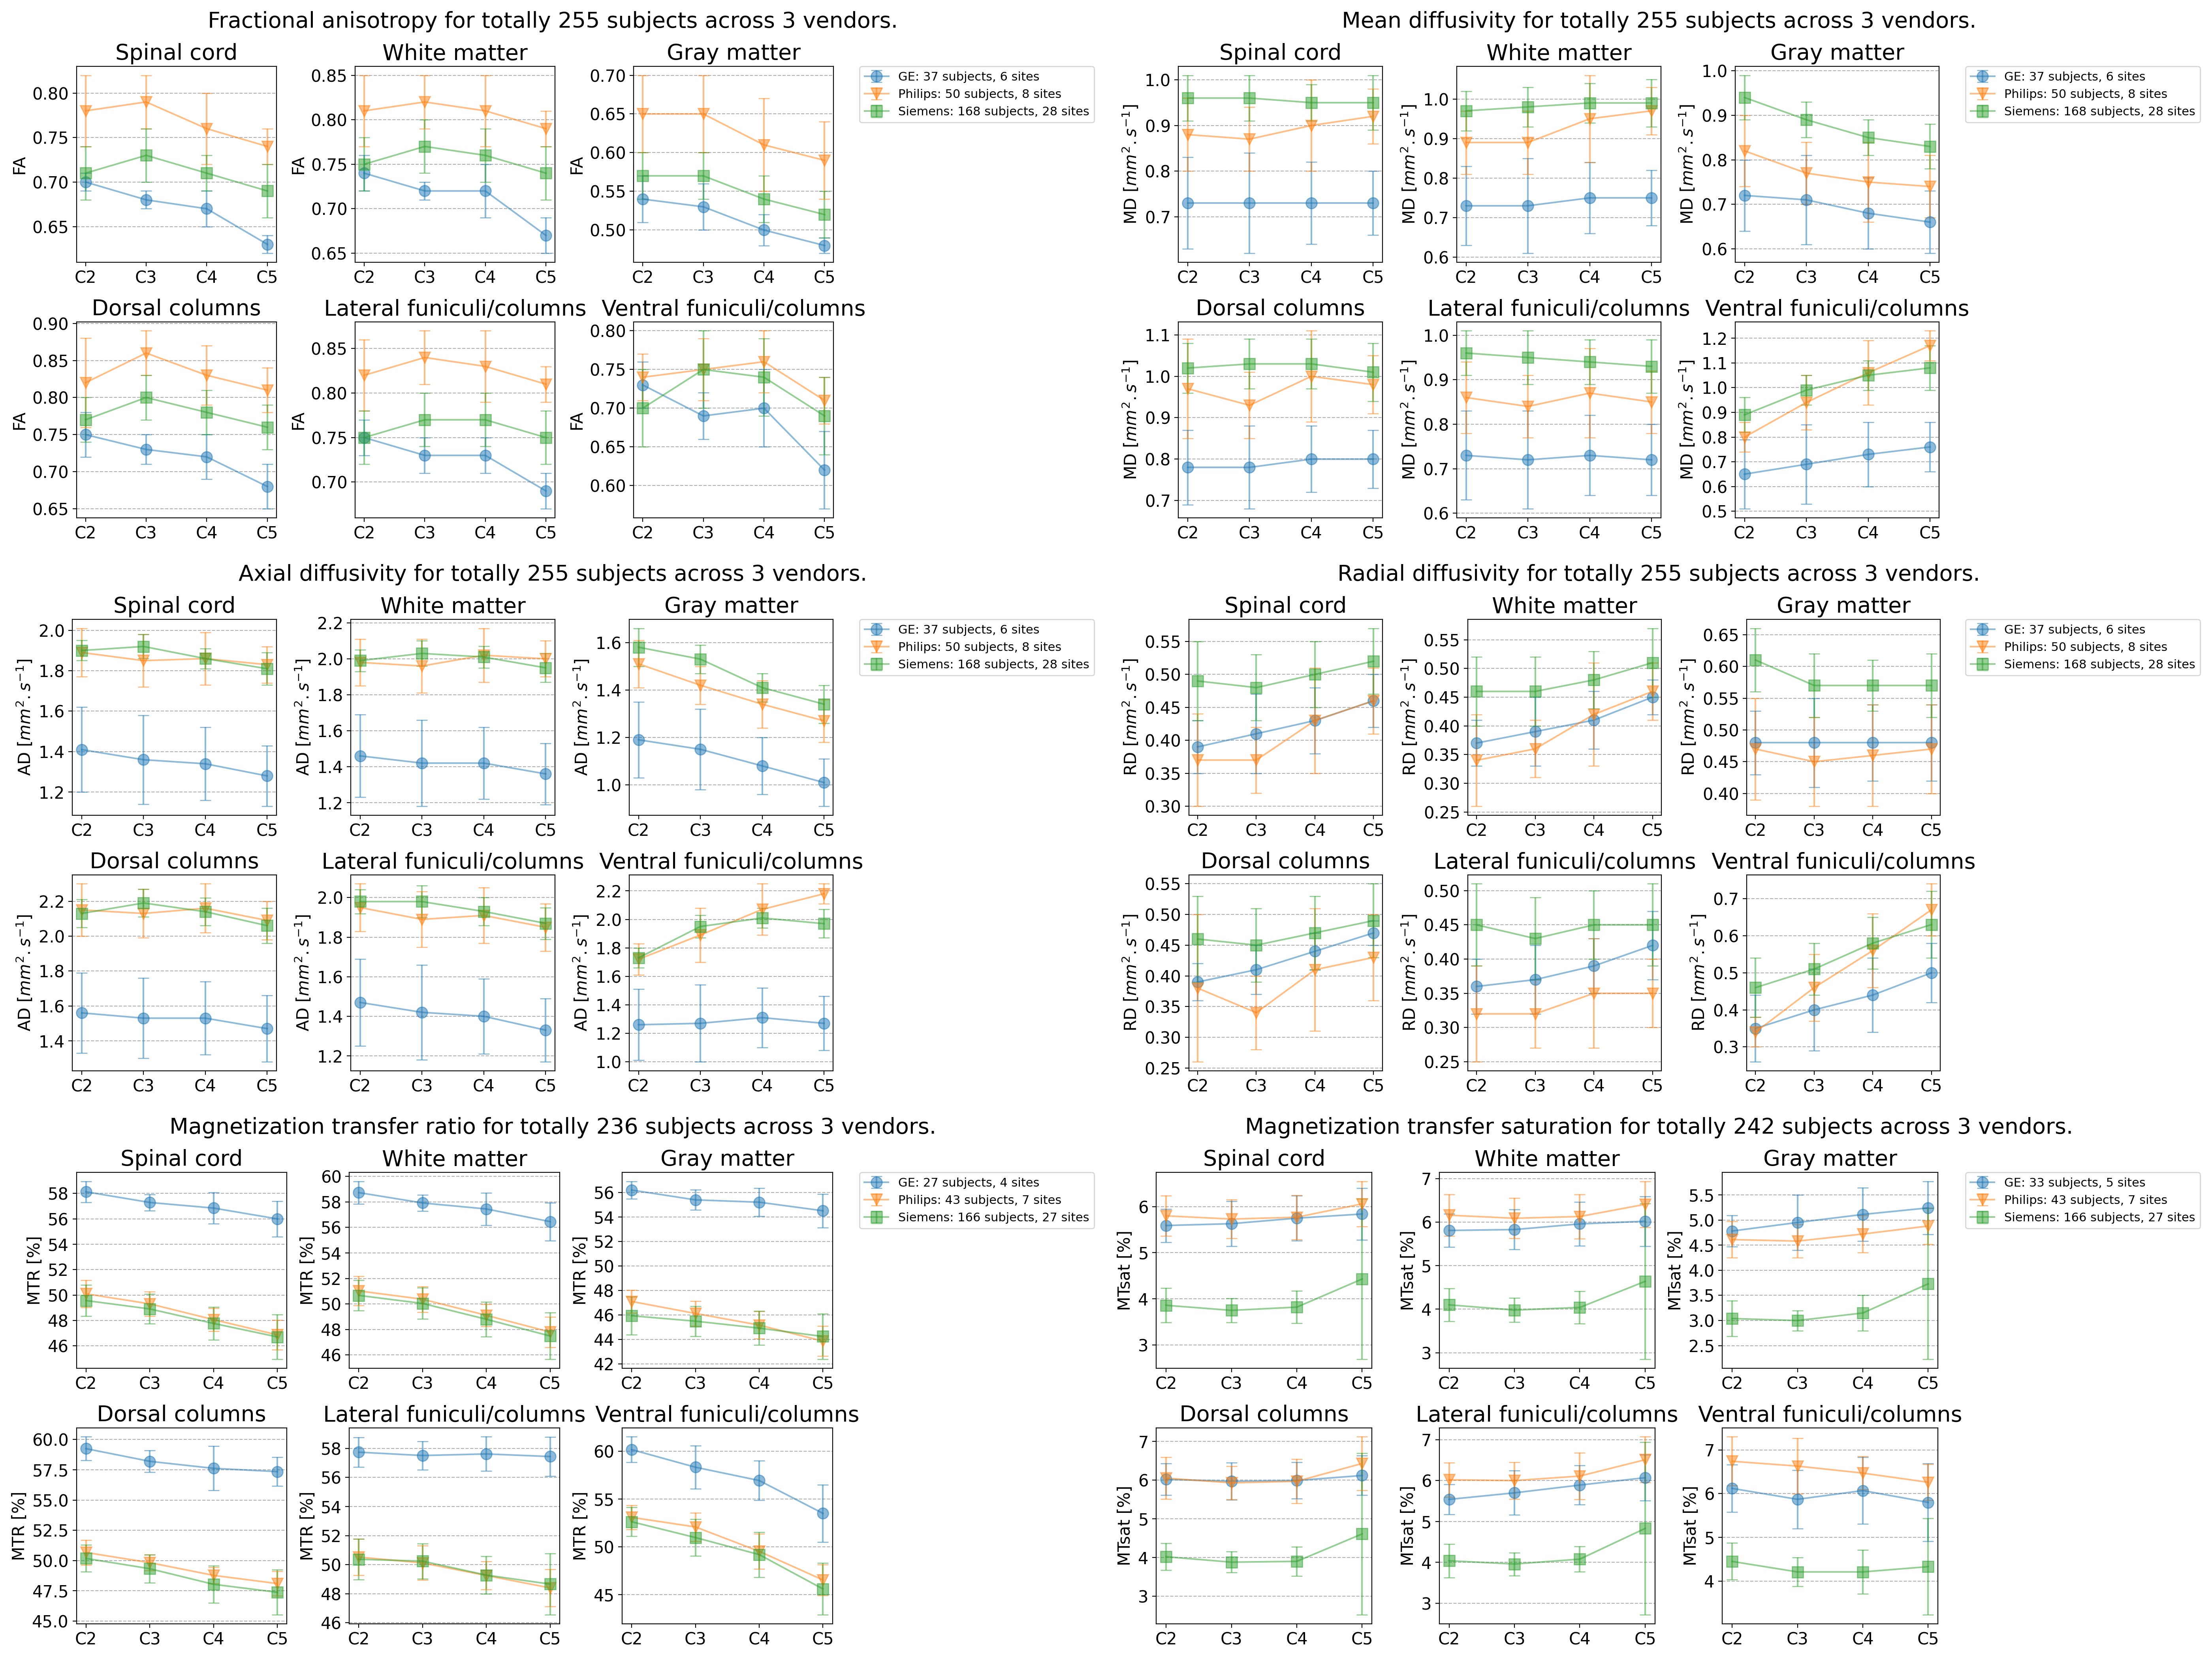
Figure 2: Variations of individual qMRI metrics across vertebral levels from C2 to C5 for 6 different regions-of-interest (spinal cord, white matter, gray matter, dorsal columns, lateral columns, ventral columns). Mean and standard deviation values are shown.