Anirban Sengupta1, Arabinda Mishra1, Feng Wang1, Li Min Chen1, and John C. Gore1
1Vanderbilt University Medical Center, Nashville, TN, United States
1Vanderbilt University Medical Center, Nashville, TN, United States
Stimulus evoked BOLD fluctuations and correlated resting
state BOLD signal was detected robustly in spinal cord WM. Resting state WM correlations
followed a trend which mimicked spinal cord functional recovery after an
injury. (33 words)
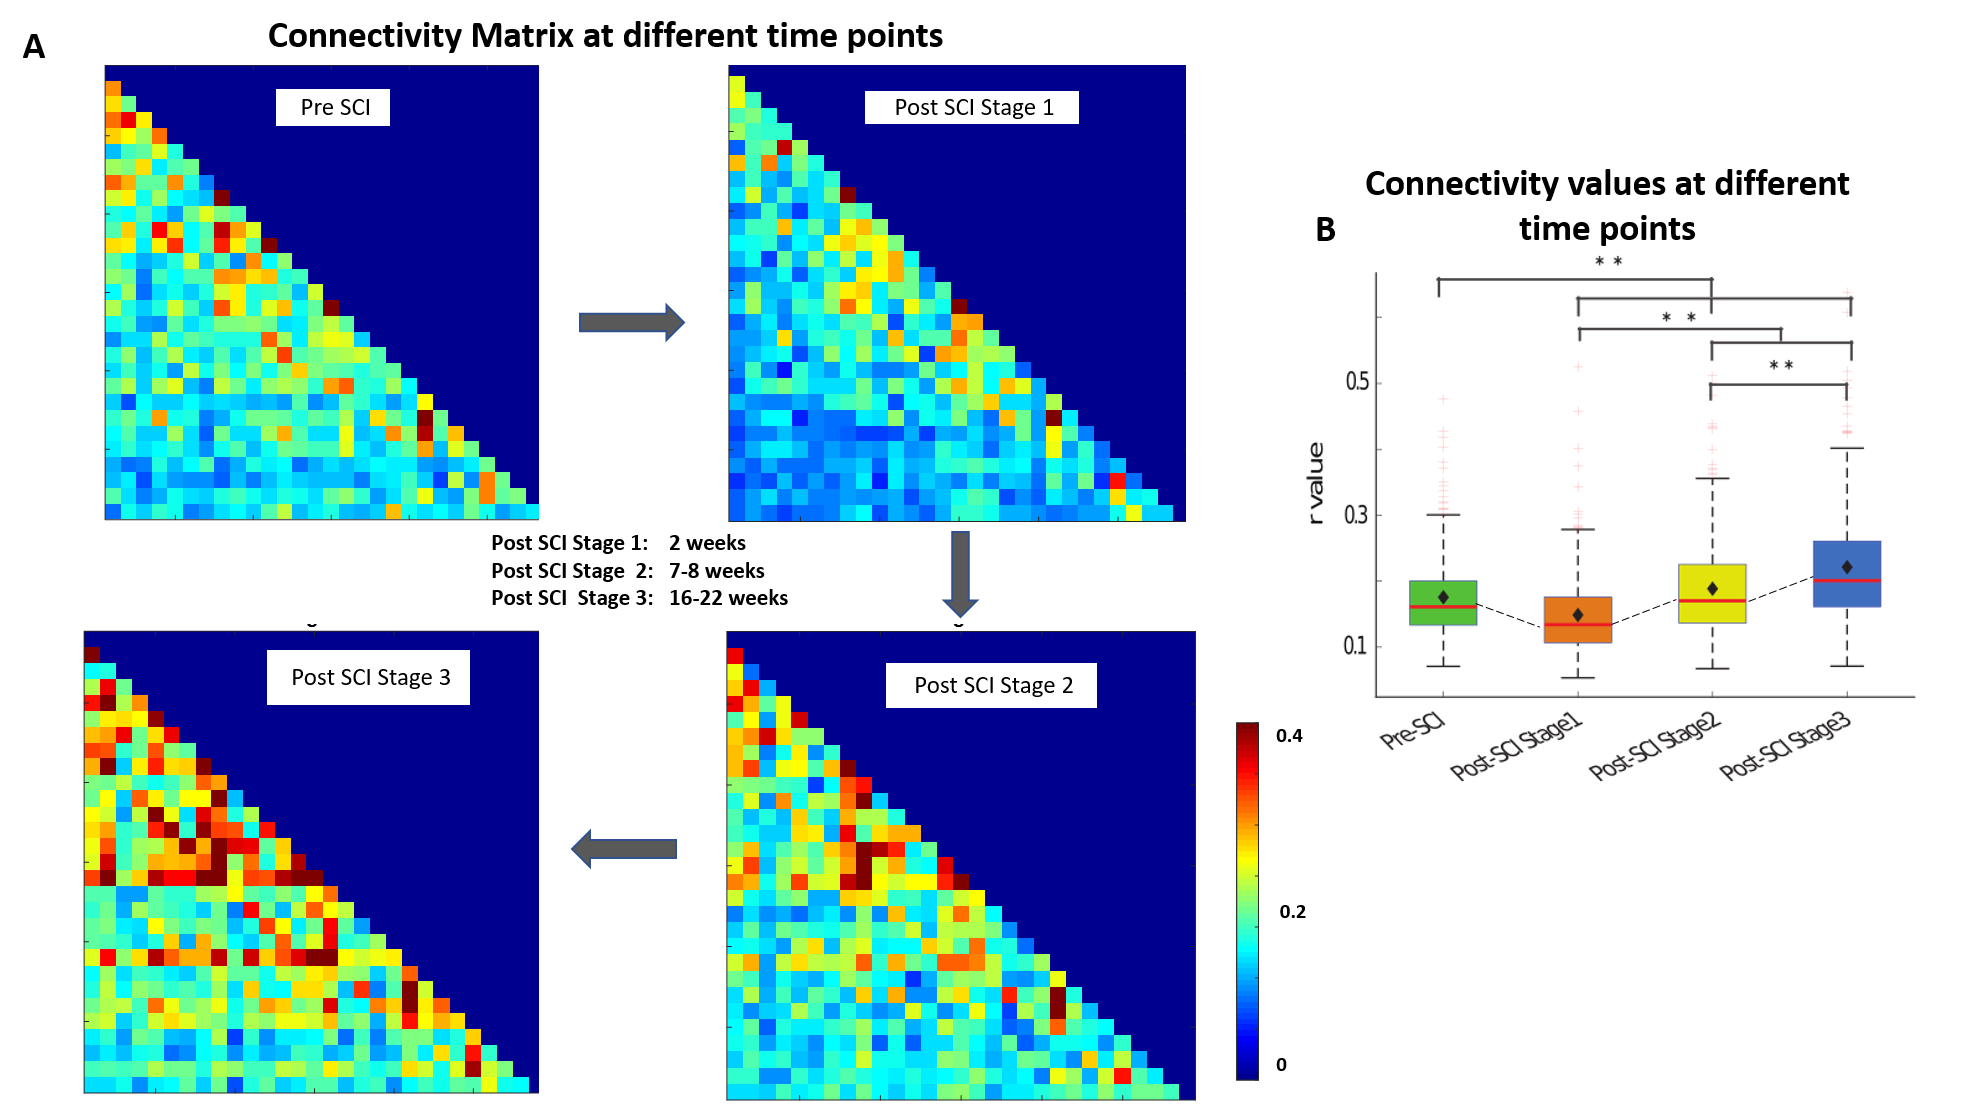
Figure4: (A) Connectivity
matrix (absolute
values) averaged
over
15 runs of 5 monkeys at
different
time points (Pre-SCI, Post-SCI Stage1 (2 weeks), Post-SCI Stage2 (7-8 weeks)
and Post-SCI Stage3 (16-22 weeks). (B) Box-plot
of the connectivity values at different time points . The dotted line joins the
median of the box-plots. Significantly different box-plots using Wilcoxon
non-parametric test are denoted by * (p<0.05) and ** (p<0.01) .
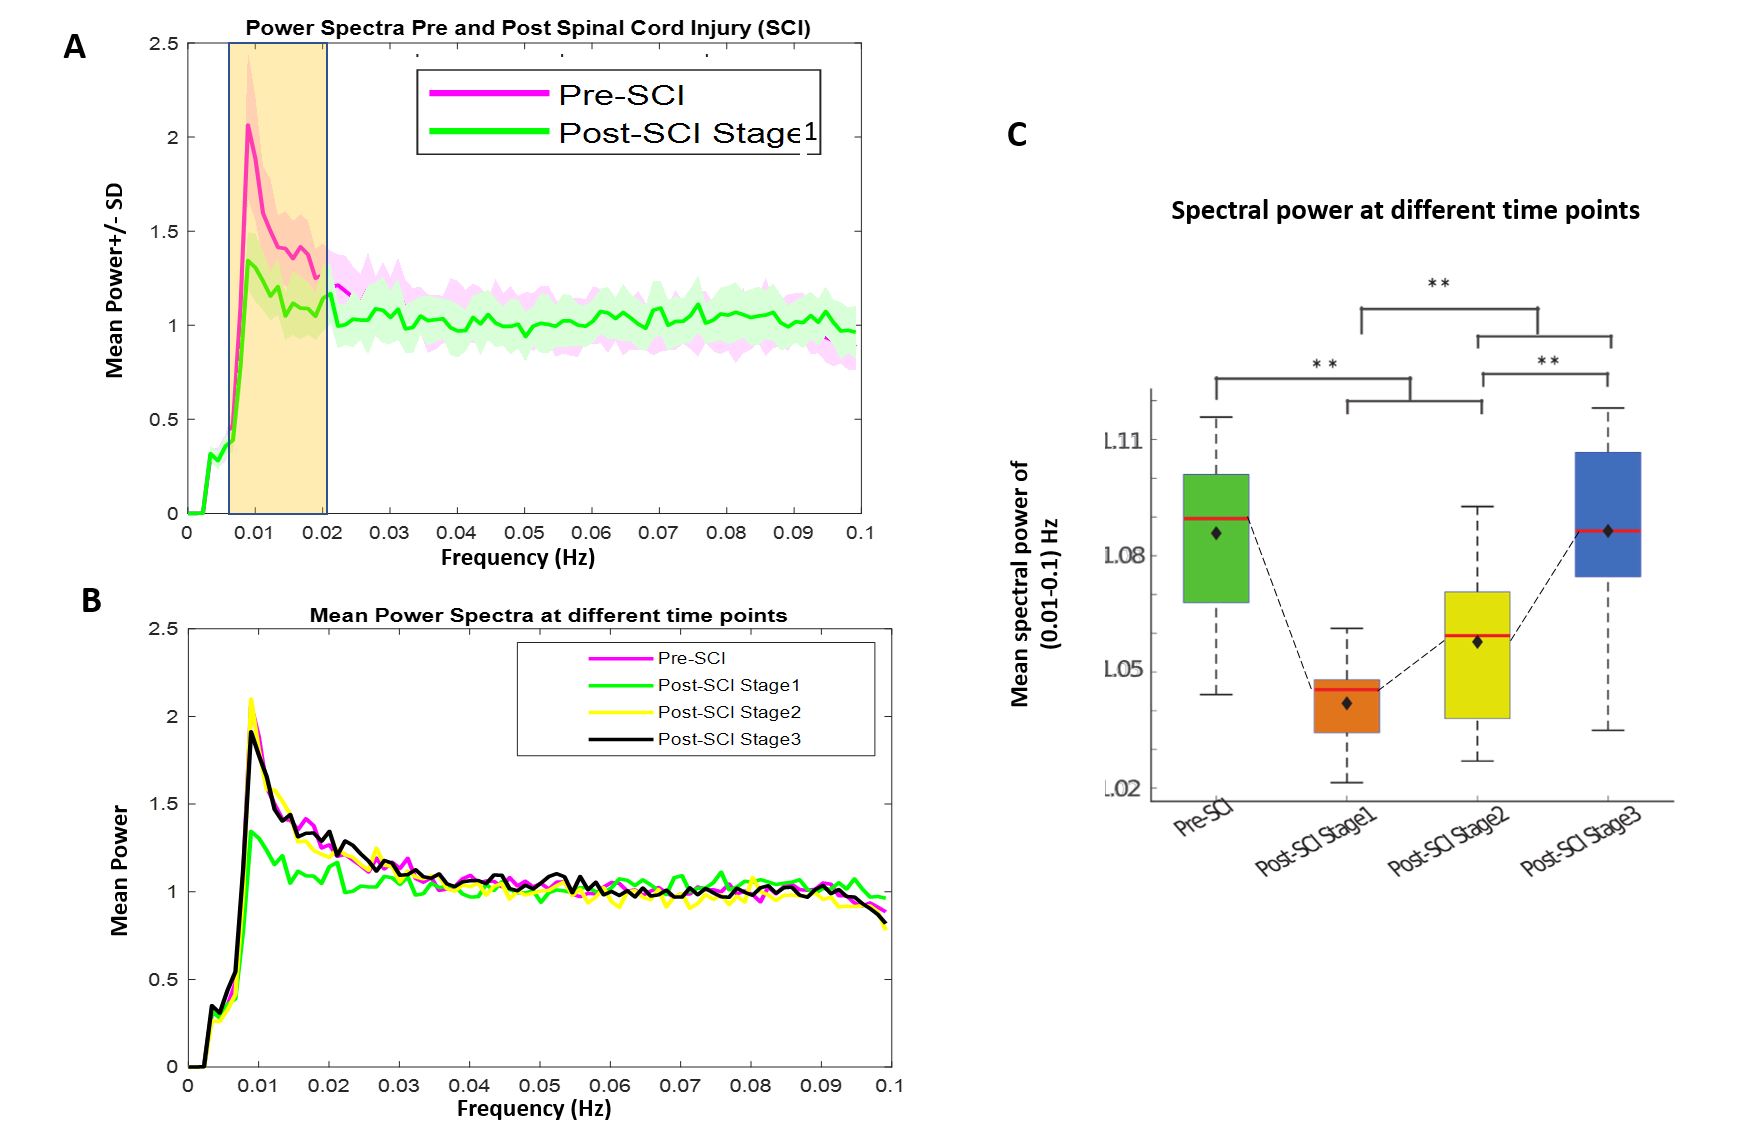
Figure
5: (A)
Mean
+/- SD of power
spectra (0.01-0.1Hz) of all ICs (averaged
over 15 runs of 5 monkeys ) at pre-and post-SCI stage 1. The shaded bar denotes
the region where the drop in connectivity is conspicuously observed.(B)
Mean
of all IC’s power spectra at different time points i.e. pre- and post SCI
stage1-3. (C)
Box
plot of averaged (0.01-0.1 Hz) spectral power for all ICs at different time
points. The
dotted line joins the median of the box-plots. Statistically significant difference
using Wilcoxon non-parametric test are denoted by * (p <.05) and **
(p<.01).