1NMR Research Unit, Queen Square MS Centre, Department of Neuroinflammation, UCL Queen Square Institute of Neurology, Faculty of Brain Sciences, University College London (UCL), London, United Kingdom, 2Centre for Medical Image Computing, Department of Medical Physics and Biomedical Engineering, University College London (UCL), London, United Kingdom, 3Radiomics Group, Vall d’Hebron Institute of Oncology, Vall d’Hebron Barcelona Hospital Campus, Barcelona, Spain, 4National Hospital For Neurology and Neurosurgery, London, United Kingdom, 5Department of Uro-Neurology, The National Hospital for Neurology and Neurosurgery and UCL Queen Square Institute of Neurology, London, United Kingdom, 6Department of Brain & Behavioural Sciences, University of Pavia, Pavia, Italy, 7Brain Connectivity Centre Research Department, IRCCS Mondino Foundation, Pavia, Italy
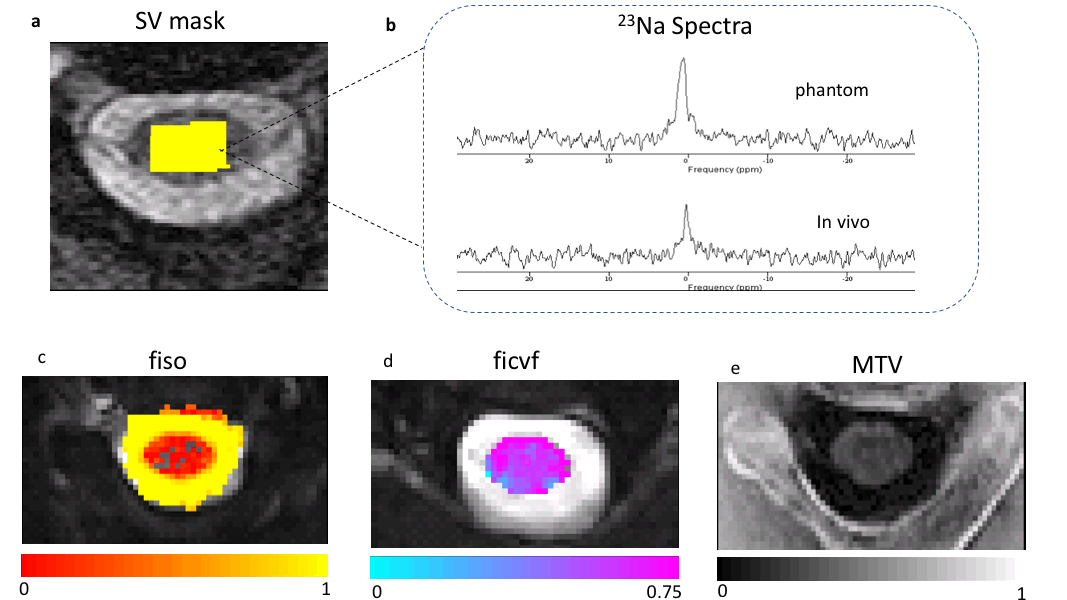
Figure 1
a) 2D-T2w gradient echo image with the corresponding 23Na MRS voxel (SV) positioning in the cervical spinal cord in yellow, b) representative 23Na spectra from in vivo and phantom scans, used to quantify total sodium concentration. Example of multi-shell diffusion NODDI maps for c) fiso (fraction of free protons) and d) ficvf (fraction of restricted protons) for extracellular and intraneurite space evaluation, d) macromolecular tissue volume (MTV) map to quantify MTV in the spinal cord.
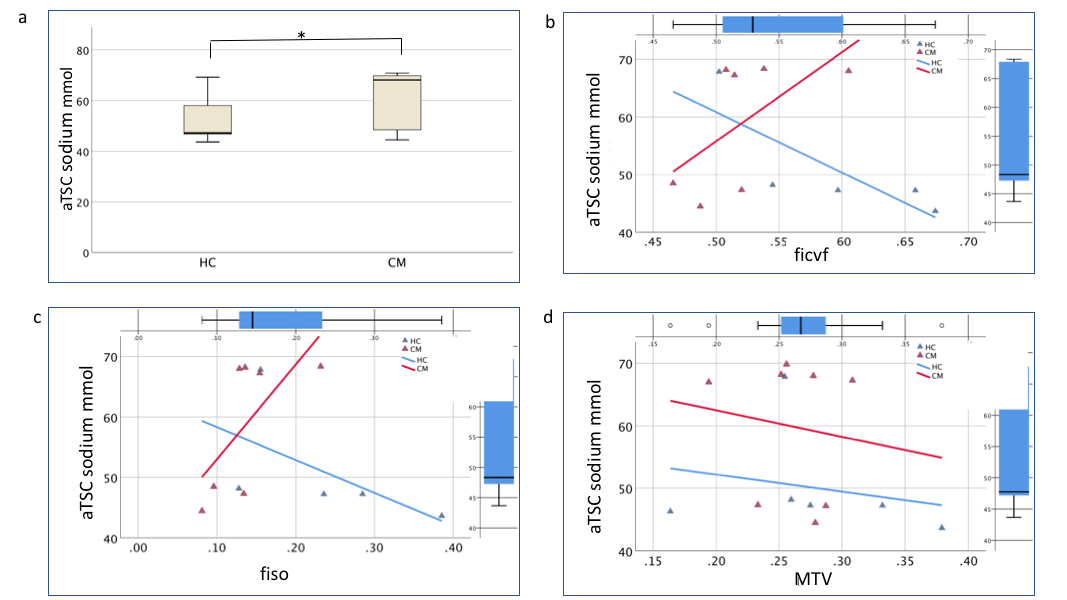
Figure 2.
Results for total sodium concentration adjusted for gender in the cervical spinal cord (aTSC), in both healthy controls (HC) and cervical myelopathy patients (CM). a) boxplots for HC and CM aTSC (* p<0.05).
Regression variable plots for aTSC in HC (blue) and CM (red) groups. aTSC correlations to b) ficvf (fraction of restricted protons, an indication of intracellular space) c) fiso (fraction of free protons, a measure of extracellular space) and d) macromolecular tissue volume (MTV).