Kimberly J Hemmerling1,2 and Molly G Bright1,2
1Biomedical Engineering, McCormick School of Engineering, Northwestern University, Evanston, IL, United States, 2Physical Therapy & Human Movement Sciences, Feinberg School of Medicine, Northwestern University, Chicago, IL, United States
1Biomedical Engineering, McCormick School of Engineering, Northwestern University, Evanston, IL, United States, 2Physical Therapy & Human Movement Sciences, Feinberg School of Medicine, Northwestern University, Chicago, IL, United States
Spinal cord imaging data can be simply visualized during an fMRI processing pipeline as a 2D signal intensity heatmap. Different anatomical organizations of the heatmap show how the interpretation of structured variations in the data are affected.
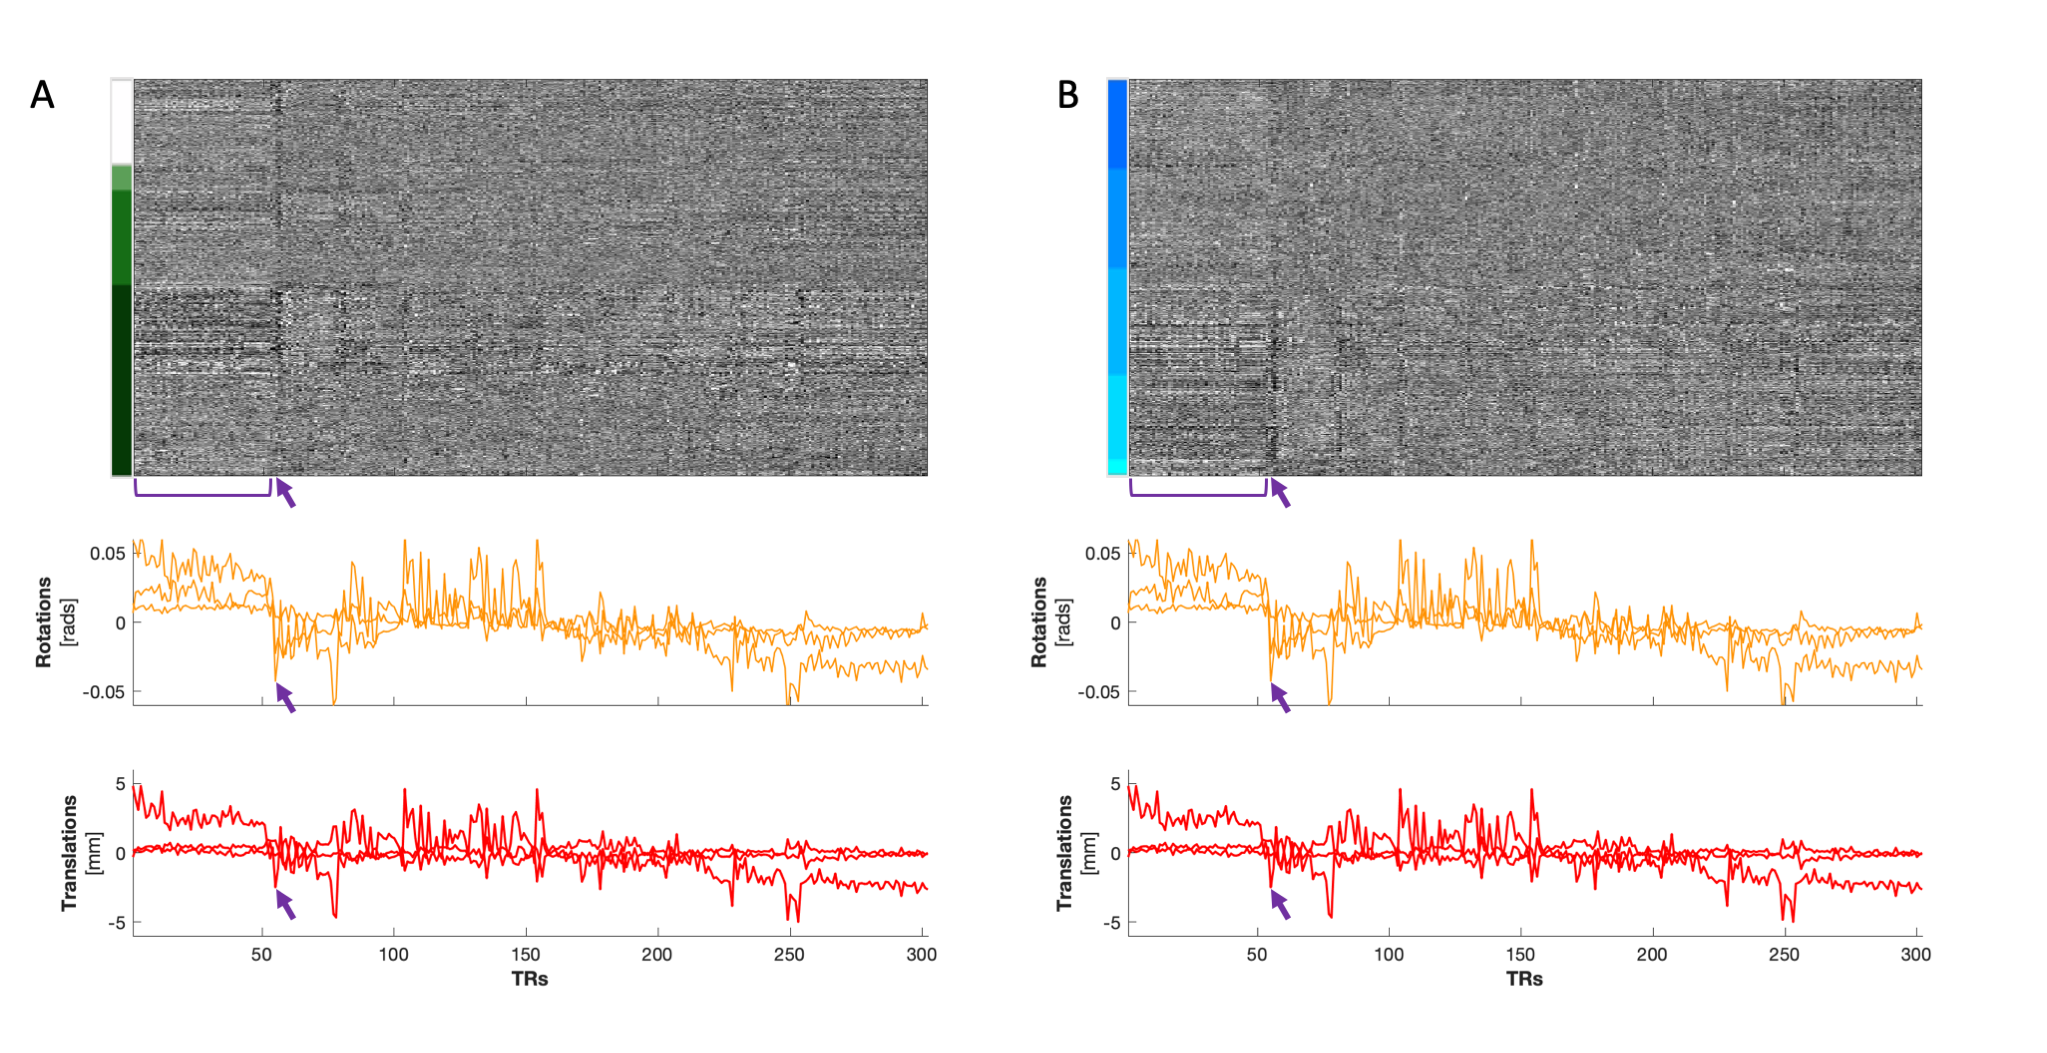
(A) Heatmap organized by tissue type and (B) by vertebral level (C3-C7) in a BH scan. Two structures of motion are notable in these plots: a more prolonged movement indicated by the bracket that appears predominantly in the Rz and Ty motion traces, and a brief movement indicated by the arrows that is most pronounced in Rx, Rz, and Ty. The prolonged movement is discernible in GM and in WM tissues. The brief movement appears to have a more continuous gradation along the y-axis when organized by vertebral level, and the signal increases in magnitude from C3 to C7.
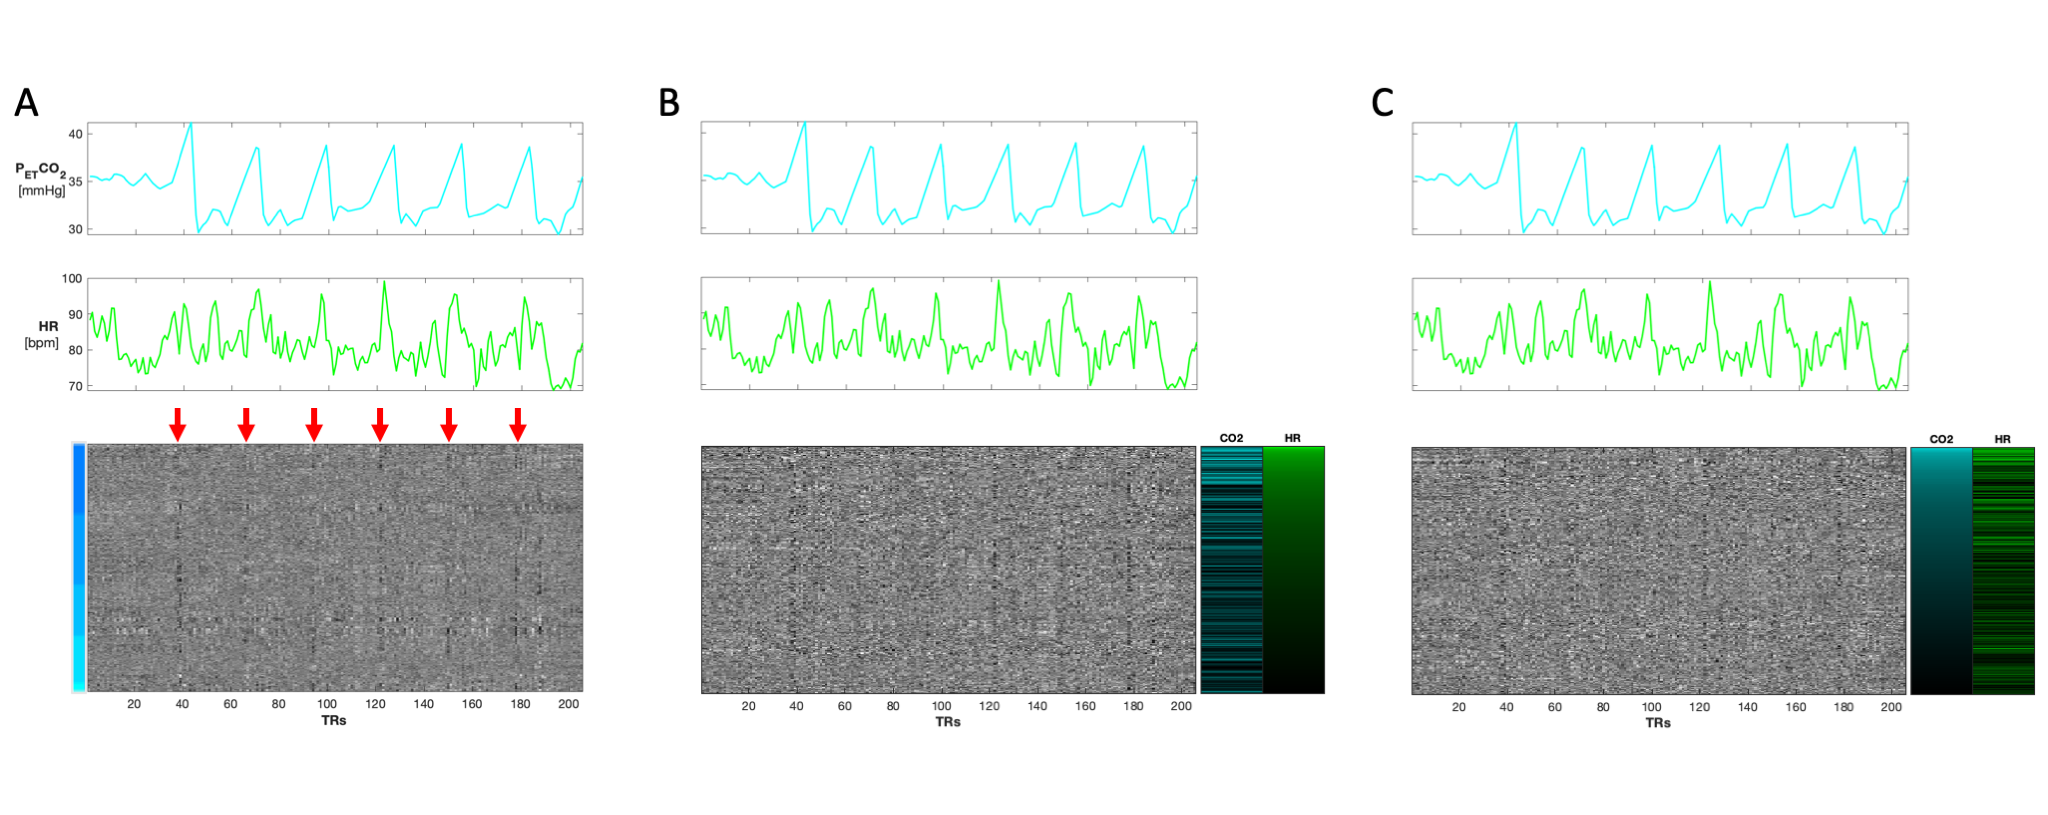
Three heatmaps of a BH scan organized first by (A) vertebral level (C3-C7). Red arrows indicate the location of BHs which coincide with the PETCO2 and HR traces above the heatmap. (B) Heatmap reorganized by GLM derived t-statistics for HR. (C) Heatmap reorganized by GLM derived t-statistics for PETCO2. Motion regressors were also included in the GLM but are not shown here. For simplicity of the color scale, the absolute values of the t-statistics are shown. Though the organization is changed, the structured variation from the BH paradigm is visible in all three heatmap variations.