Zahra Shams1, Dennis W.J. Klomp1, Vincent O. Boer2, Jannie P. Wijnen1, and Evita C. Wiegers1
1Department of radiology, University Medical Center Utrecht, Utrecht, Netherlands, 2Danish Research Centre for Magnetic Resonance, Centre for Functional and Diagnostic Imaging and Research, Copenhagen University Hospital Hvidovre, Hvidovre, Denmark
1Department of radiology, University Medical Center Utrecht, Utrecht, Netherlands, 2Danish Research Centre for Magnetic Resonance, Centre for Functional and Diagnostic Imaging and Research, Copenhagen University Hospital Hvidovre, Hvidovre, Denmark
We analyzed the possible locations of which stimulated
echoes could arise, where the dephasing of the local magnetic field
inhomogeneity opposed the crusher gradients. This leads to signal rephasing.
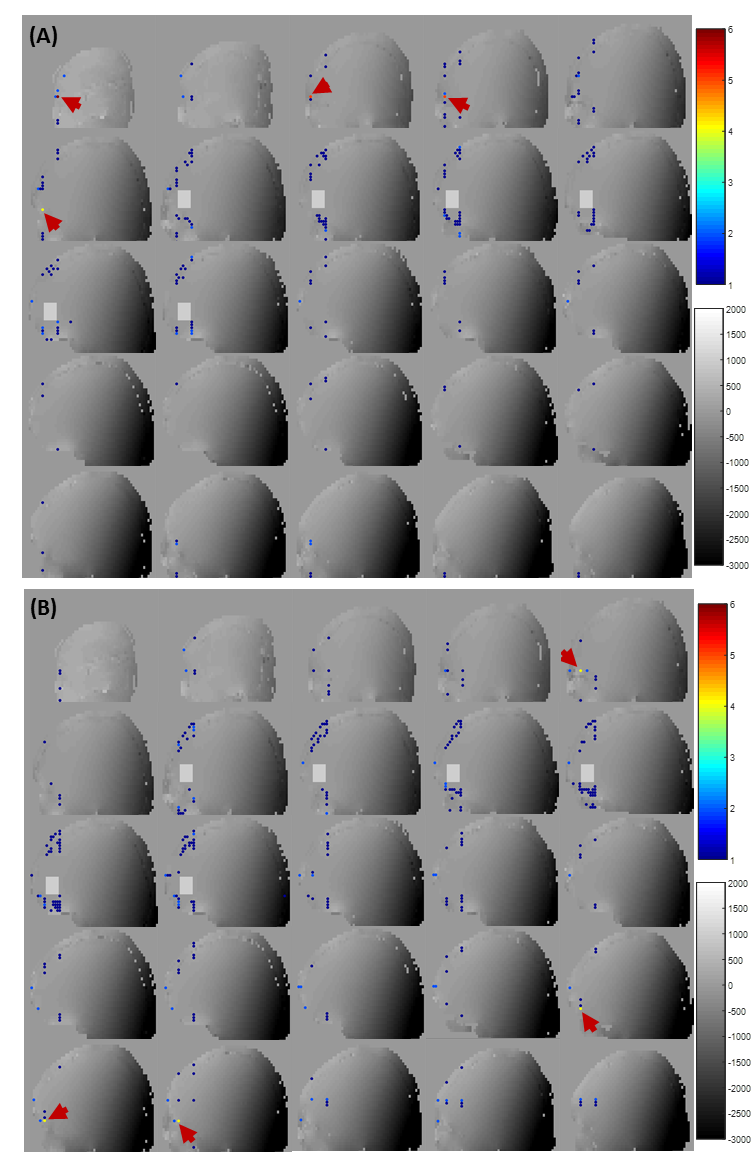
Figure 3. Maximum intensity projection (MIP) maps
of all possible pathways for (A) the optimized crusher scheme and (B) the same
scheme with reverse polarities of the gradients along FH direction. The MIP
maps depict the number of occurrence among all pathways per B0 map
(PB-2nd) voxel where φcrush matches -φinhom.gradient.
The red arrows point to the locations with more than 3 occurrences through
pathways.
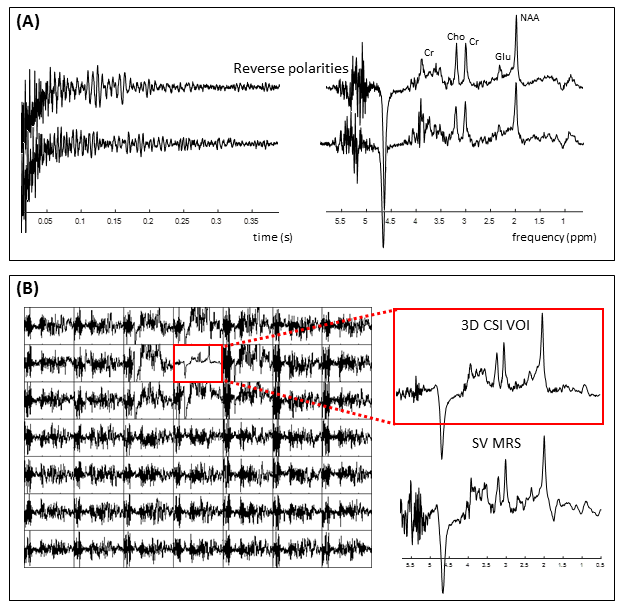
Figure 4. Spectra with PB-2nd
VOI shim setting. (A) Time and frequency domain signal from a voxel of 2 × 2 ×
2 cm3. (B) Comparison of spectra (NSA=1) acquired from CSI (spatial
resolution = 27 cm3, matrix size = 7 × 7 × 6) and SV MRS
(NSA=16) with the same localization (semi-LASER, TE = 31 ms). The
frequency domain signals from the central slice, contain the VOI (red box), of
a matrix size of 7 × 7 × 6 (left). All the spectra in the grid are scaled by a
factor of 10 compared to the VOI. Resulting spectrum from SV MRS which was
placed on the VOI can be seen in the right-bottom of the figure.