Frits H.A. van Heijster1, Jason G. Skinner1, Tim Wartewig2, Christian Hundshammer1, Martin Grashei1, Geoffrey J. Topping1, Erik Hameister2, Jürgen Ruland2, and Franz Schilling1
1Technical University Munich, Nuclear Medicine, Klinikum rechts der Isar, München, Germany, 2Technical University Munich, TranslaTUM, Center for Translational Cancer Research, München, Germany
1Technical University Munich, Nuclear Medicine, Klinikum rechts der Isar, München, Germany, 2Technical University Munich, TranslaTUM, Center for Translational Cancer Research, München, Germany
Glycolytic phenotypes of T-cell
lymphoma are characterized using hyperpolarization 13C-MR spectroscopy/imaging and [18F]PET imaging. The complementary information
of the two modalities gives a more complete view of the characteristics of the
glycolytic phenotypes in T-cell lymphoma.
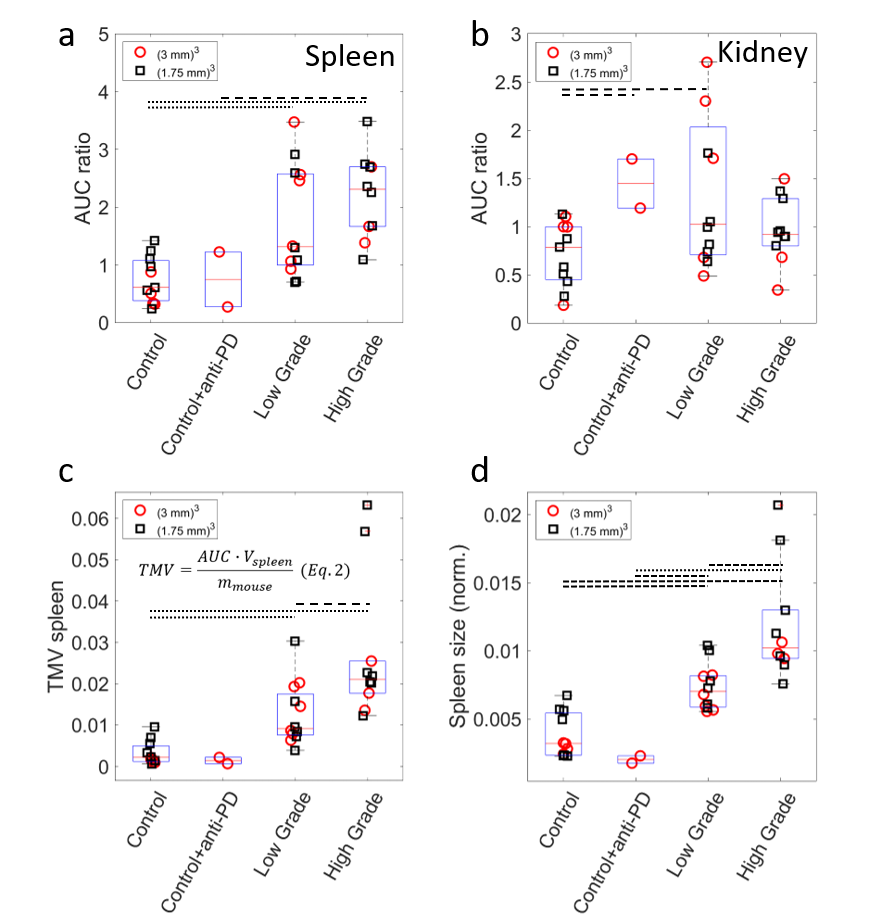
Figure
4: Area-under-the-curve ratios of hyperpolarized lactate over pyruvate for
spleens (a) and kidney regions (b). Tumor metabolic volumes are calculated for
spleens (c) and spleen sizes are measured (d). Significant differences
indicated with dotted line p<0.01
or striped line p<0.05.
The different resolution reached in 13C
imaging is indicated.
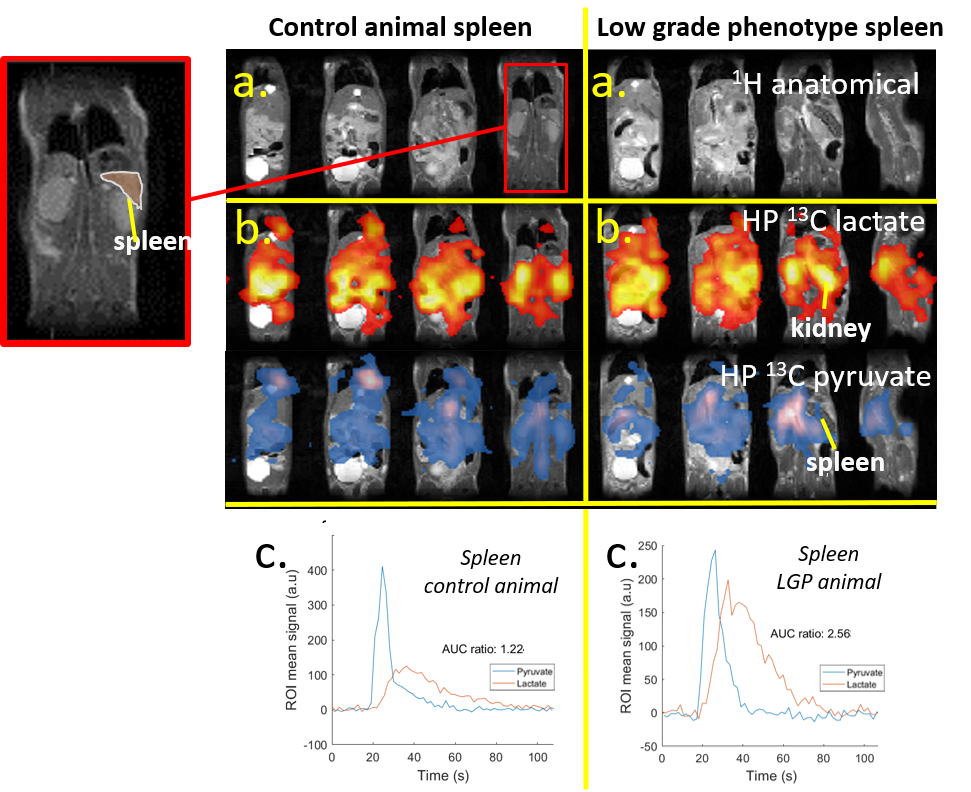
Figure
2: a. ROI are selected in 1H-RARE
images, spleen indicated. b) 13C
images of hyperpolarized lactate (orange) and pyruvate (blue) show high levels
of lactate in kidneys. Calculation of integrals over time of these metabolites
results in the curves in c.) Analysis of AUC ratios gives an unique insight in
exchange rate between of HP pyruvate and HP lactate.