Kevin Moulin1,2,3, Pierre Croisille4,5, Magalie Viallon4,5, Ilya A Verzhbinsky6, Luigi E Perotti7, and Daniel B Ennis1,2,3
1Department of Radiology, Stanford University, Stanford, CA, United States, 2Department of Radiology, Veterans Administration Health Care System, Palo Alto, CA, United States, 3Cardiovascular Institute, Stanford University, Stanford, CA, United States, 4University of Lyon, UJM-Saint-Etienne, INSA, CNRS UMR 5520, INSERM U1206, CREATIS, F-42023, Saint-Etienne, France, 5Department of Radiology, University Hospital Saint-Etienne, Saint-Etienne, France, 6Medical Scientist Training Program, University of California - San Diego, La Jolla, CA, United States, 7Department of Mechanical and Aerospace Engineering, University of Central Florida, Orlando, FL, United States
1Department of Radiology, Stanford University, Stanford, CA, United States, 2Department of Radiology, Veterans Administration Health Care System, Palo Alto, CA, United States, 3Cardiovascular Institute, Stanford University, Stanford, CA, United States, 4University of Lyon, UJM-Saint-Etienne, INSA, CNRS UMR 5520, INSERM U1206, CREATIS, F-42023, Saint-Etienne, France, 5Department of Radiology, University Hospital Saint-Etienne, Saint-Etienne, France, 6Medical Scientist Training Program, University of California - San Diego, La Jolla, CA, United States, 7Department of Mechanical and Aerospace Engineering, University of Central Florida, Orlando, FL, United States
After
combining DENSE and cDTI images, in vivo
myofiber strain (Eff) was estimated to Eff=-0.14 and was more
spatially uniform than circumferential strain (Ecc). This suggests uniform
cardiomyocyte shortening in healthy adults and less geometry and layer
dependence.
Figure 1:
Post-processing steps used to combine DENSE and cDTI data and calculate
myofiber strain Eff. (A) Myofiber
orientations and Cardiac displacement fields were represented using nodes after reconstruction. (B) 2D
Displacement fields from long-axis (LA) and short-axis (SA) are combined to
obtain a SA 3D displacement field. (C) The SA 3D displacement field is used to generate a deformed cine of myofiber
orientation(D) Finally, cardiac strains are
calculated from the SA 3D displacement field and the myofiber orientations and
using beginning of systole as the initial config.
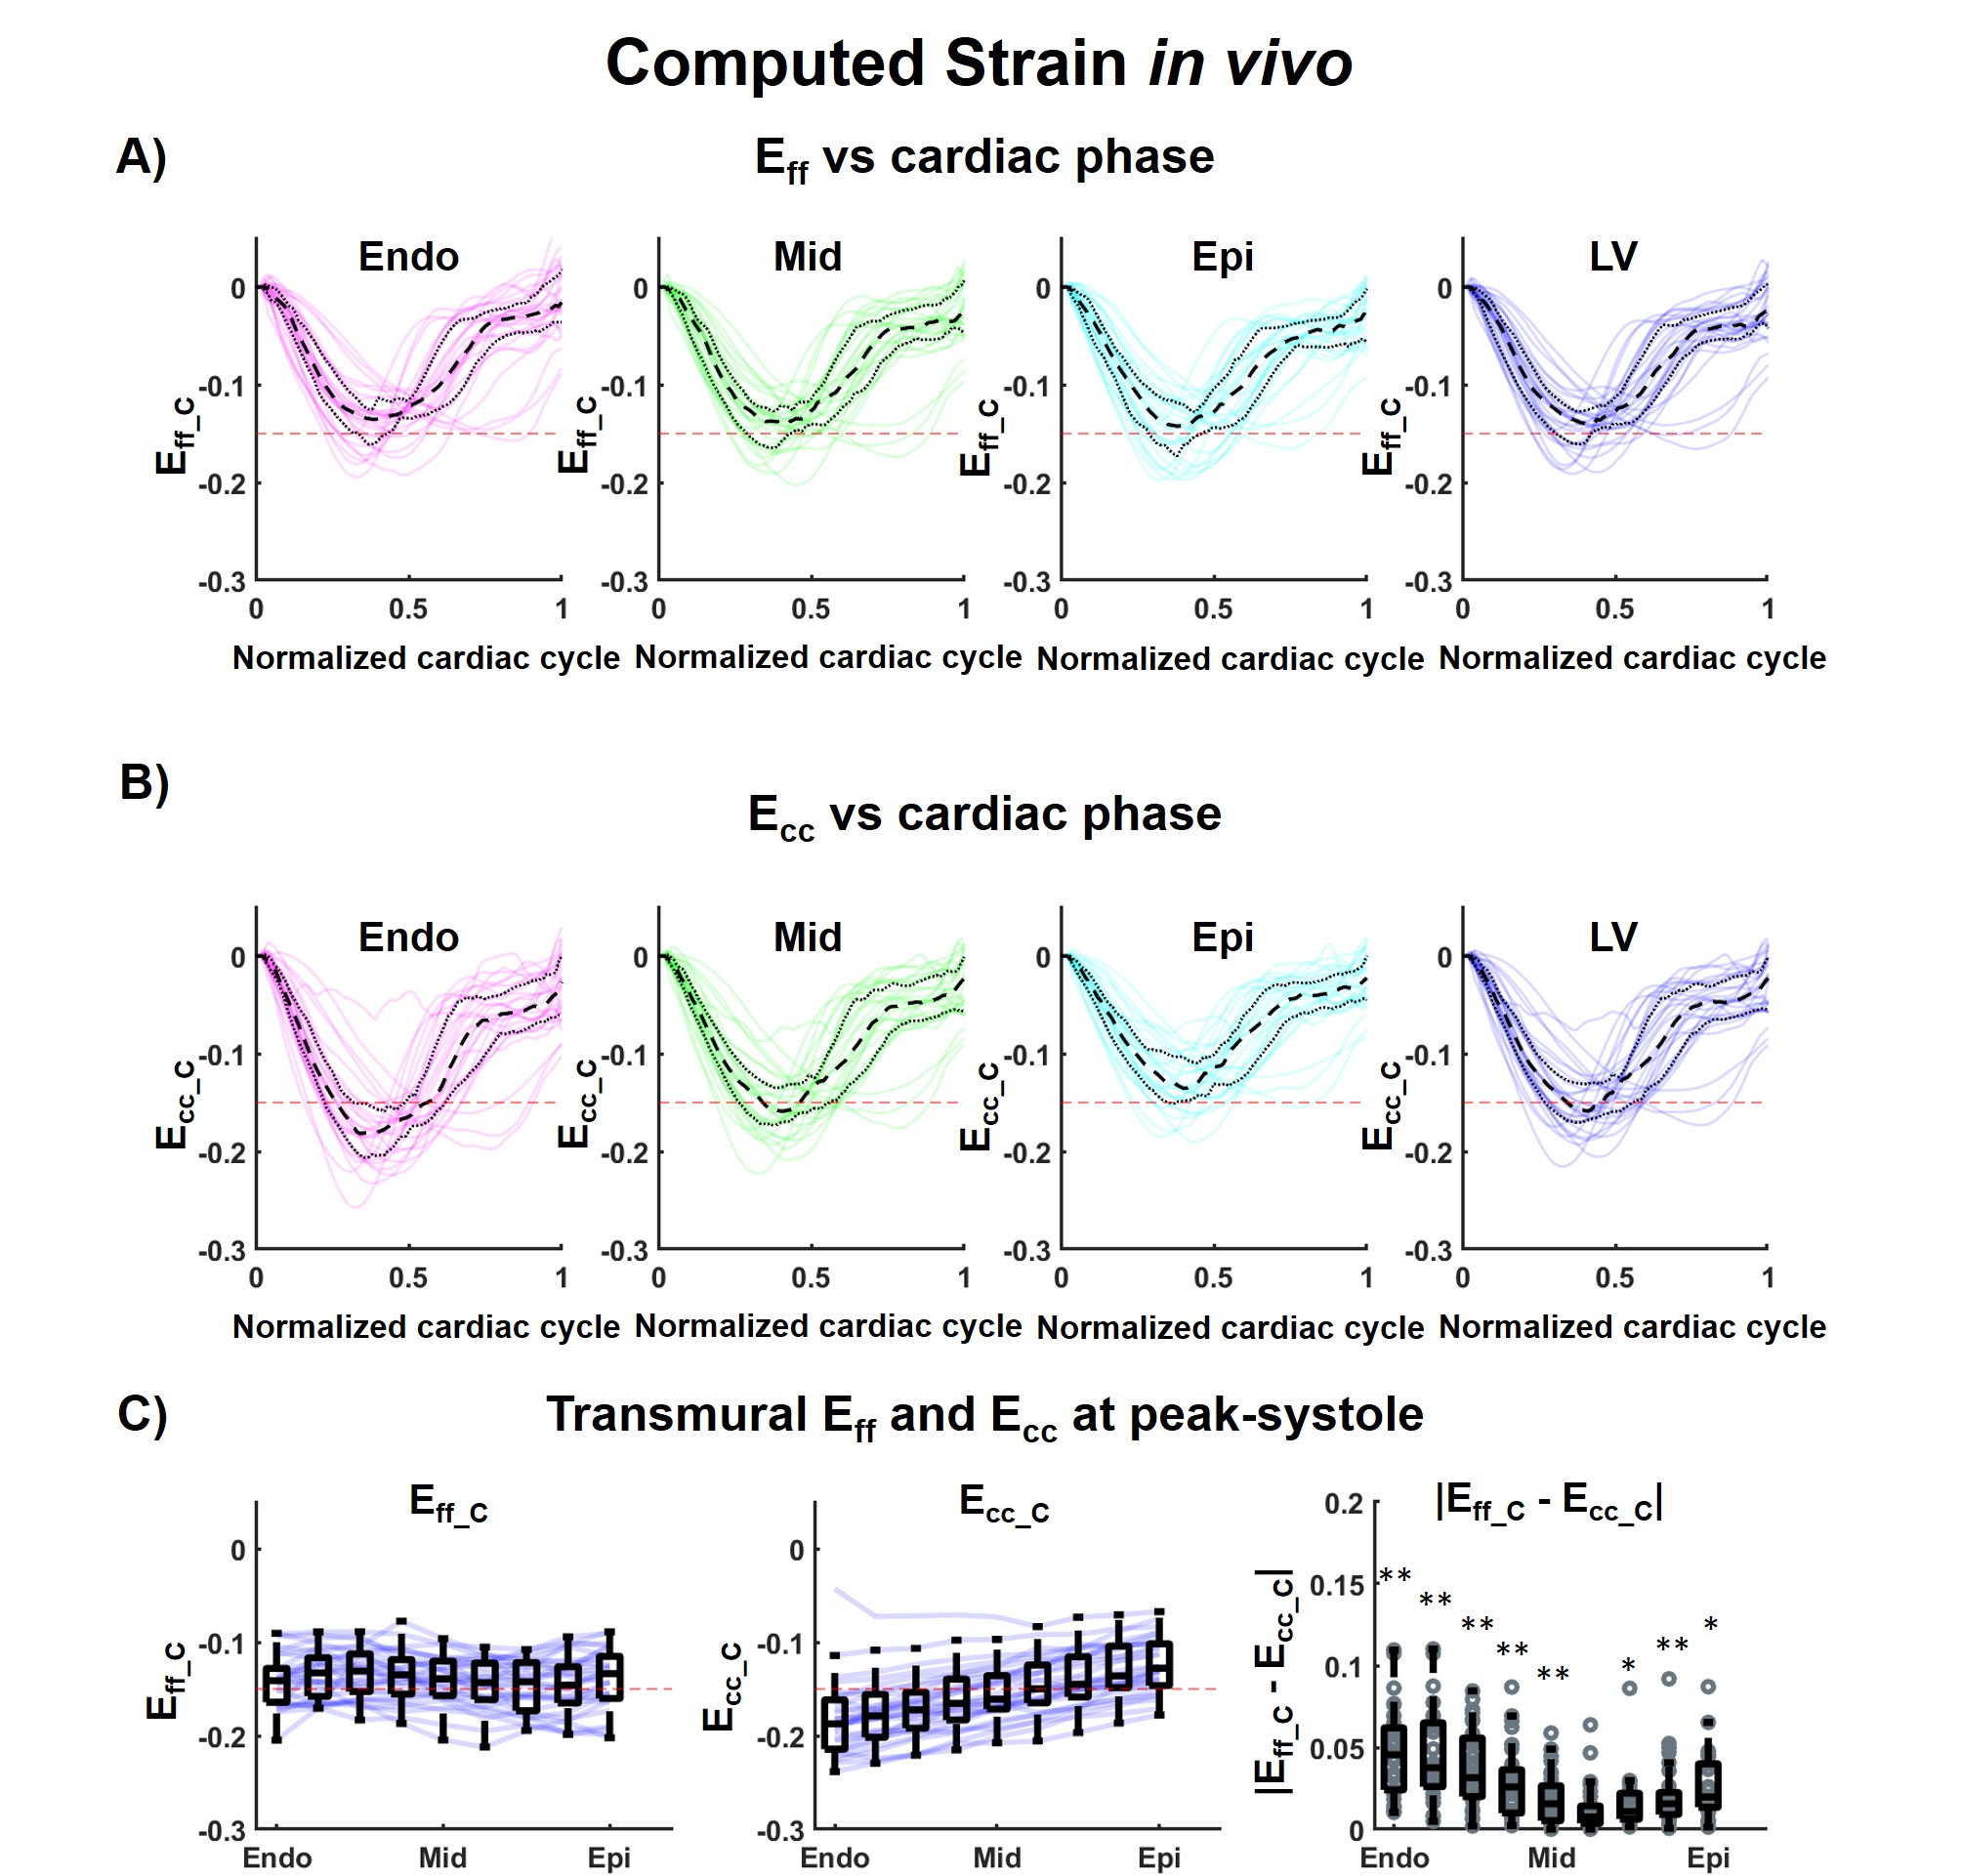
Figure
5: Computed strain (N=30) calculated after
combining cDTI and DENSE. (A) Computed Eff and (B) Ecc at endo, mid, epi layers, and across
the LV wall. The black dashed and dotted lines represent the
median [Q1, Q3] across volunteers; the red dashed line
provides a -0.15 strain ref. the colored solid lines are individual
medians per volunteers. (C) Transmural distribution of Eff, Ecc,
and their difference at
peak-systole. Blue solid lines are the median per volunteer
and the box plots are across volunteers.p-values<0.01 are represented by (**) and p-values<0.05 by
(*).