Brendan L Eck1, Nicole Seiberlich2, Scott D Flamm1,3, Jesse I Hamilton2, Mazen Hanna3, Yash Kumar4, Abhilash Suresh3, Angel Lawrence1,3, W. H. Wilson Tang3, and Deborah Kwon3
1Imaging Institute, Cleveland Clinic, Cleveland, OH, United States, 2Radiology, University of Michigan, Ann Arbor, MI, United States, 3Heart and Vascular Institute, Cleveland Clinic, Cleveland, OH, United States, 4Case Western Reserve University, Cleveland, OH, United States
1Imaging Institute, Cleveland Clinic, Cleveland, OH, United States, 2Radiology, University of Michigan, Ann Arbor, MI, United States, 3Heart and Vascular Institute, Cleveland Clinic, Cleveland, OH, United States, 4Case Western Reserve University, Cleveland, OH, United States
Native myocardial T1 and T2 from
cardiac Magnetic Resonance Fingerprinting were elevated in cardiac amyloidosis patients
relative to healthy controls. Analysis of signal evolutions improved
discrimination of disease as compared to T1 and T2 analysis.
Figure
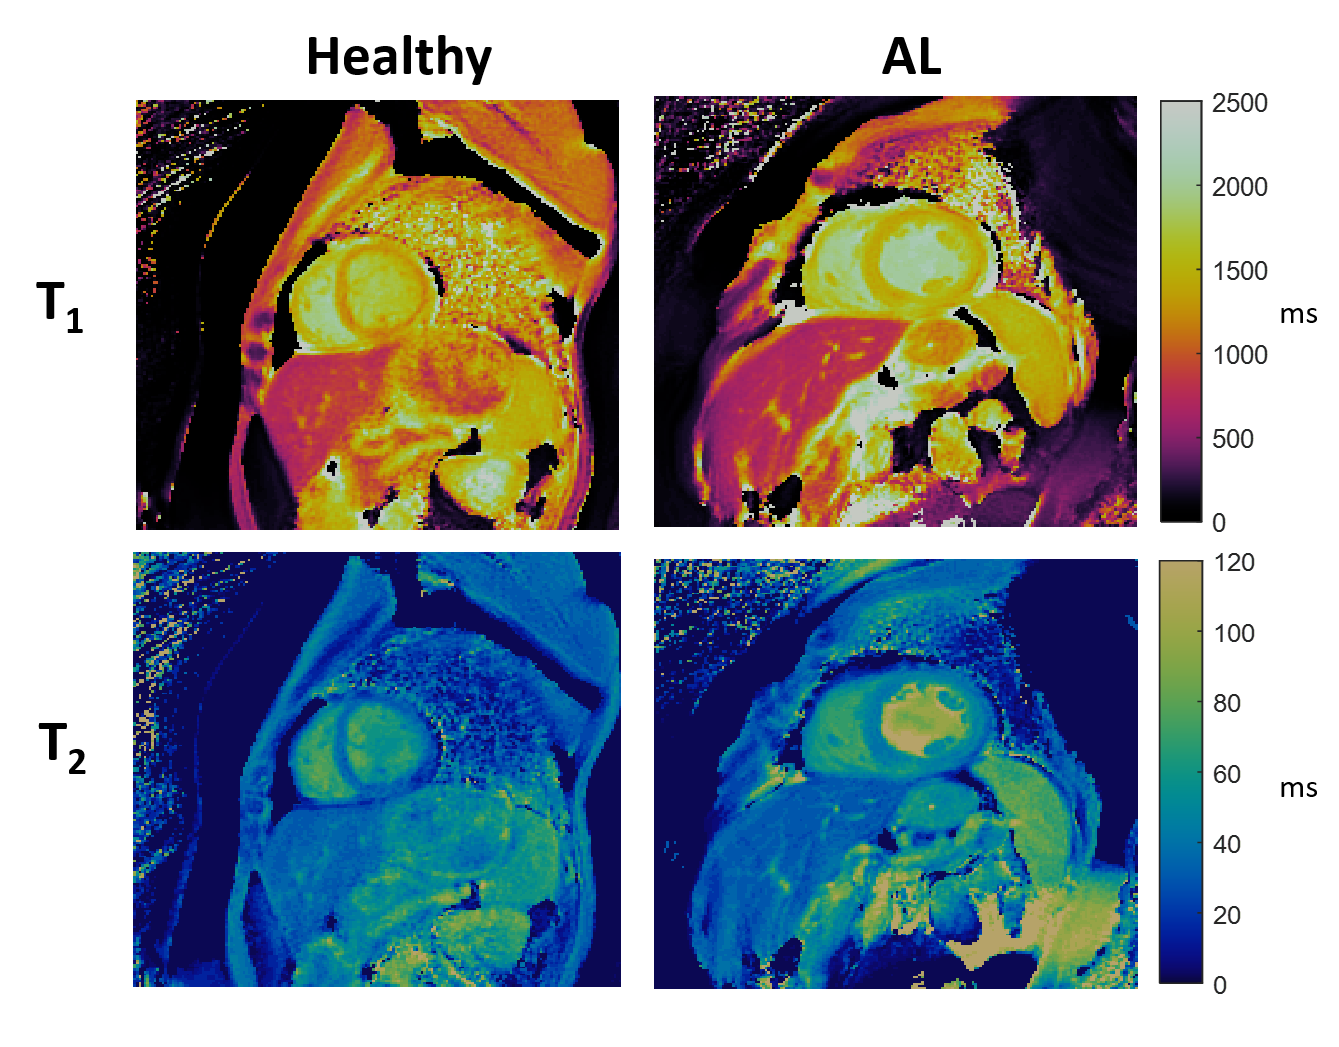
1. Example
T1 and T2 maps obtained from the cMRF sequence for a
healthy control subject and a patient with light-chain cardiac amyloidosis
(AL). Myocardial T1 and T2 appear to be elevated in the
AL patient as compared to the healthy control.
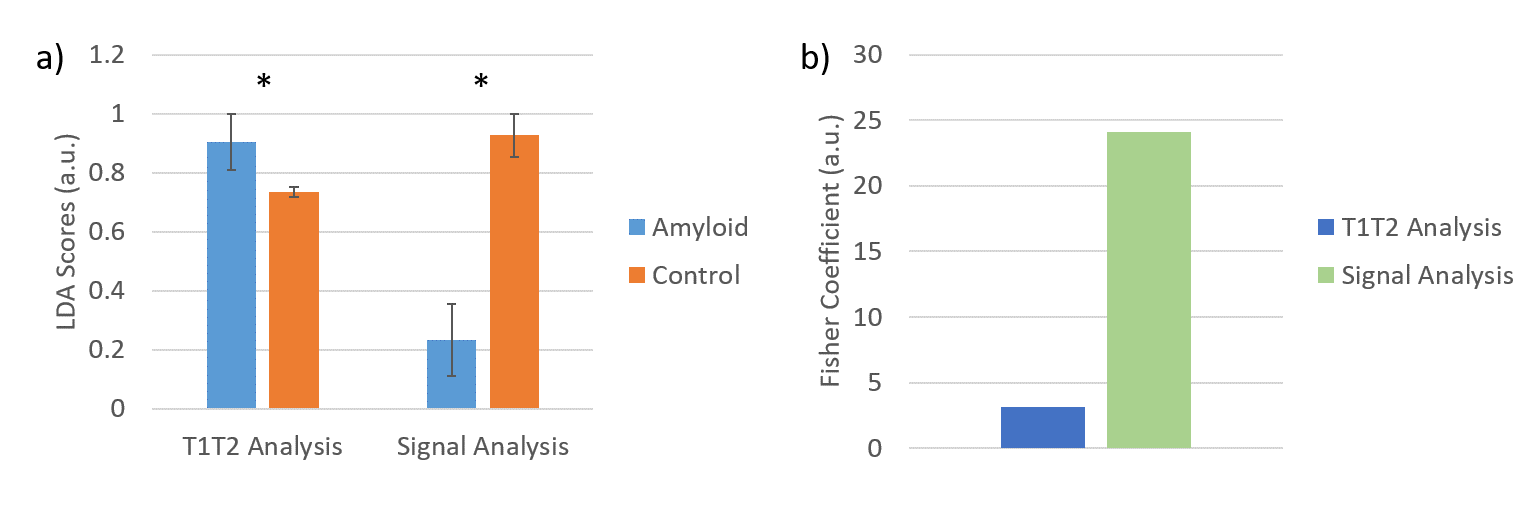
Figure 5. Linear
discriminant analysis (LDA) of relaxometric data and signal data. (a)
Bar plots of LDA score means and standard deviations obtained for patients and
controls for relaxometric data and signal evolution data. LDA scores for relaxometric data and signal data were normalized by a constant factor for each group for visualization. The * indicates a statistically
significant difference (p<0.05). (b) Fisher coefficient indicating
separability of amyloid and control groups (greater value indicates greater
separation).