Muge Karaman1,2, Guangyu Dan1,2, Lingdao Sha3, Tingqi Shi1, Weiguo Li4,5, Dan Schonfeld2,3,6, Tibor Valyi-Nagy7, and X. Joe Zhou1,2,8
1Center for Magnetic Resonance Research, University of Illinois at Chicago, Chicago, IL, United States, 2Department of Bioengineering, University of Illinois at Chicago, Chicago, IL, United States, 3Department of Electrical and Computer Engineering, University of Illinois at Chicago, Chicago, IL, United States, 4Research Resources Center, University of Illinois at Chicago, Chicago, IL, United States, 5Department of Radiology, Northwestern University, Chicago, IL, United States, 6Department of Computer Science, University of Illinois at Chicago, Chicago, IL, United States, 7Department of Pathology, University of Illinois at Chicago, Chicago, IL, United States, 8Departments of Radiology and Neurosurgery, University of Illinois at Chicago, Chicago, IL, United States
1Center for Magnetic Resonance Research, University of Illinois at Chicago, Chicago, IL, United States, 2Department of Bioengineering, University of Illinois at Chicago, Chicago, IL, United States, 3Department of Electrical and Computer Engineering, University of Illinois at Chicago, Chicago, IL, United States, 4Research Resources Center, University of Illinois at Chicago, Chicago, IL, United States, 5Department of Radiology, Northwestern University, Chicago, IL, United States, 6Department of Computer Science, University of Illinois at Chicago, Chicago, IL, United States, 7Department of Pathology, University of Illinois at Chicago, Chicago, IL, United States, 8Departments of Radiology and Neurosurgery, University of Illinois at Chicago, Chicago, IL, United States
The
machine-learning classifier that quantifies histology-based heterogeneity
achieved an accuracy of 90% and specificity of 94%. The CTRW parameters, Dm, α, β showed
significant differences (p<0.05) among heterogeneity levels in normal
and glioma tissue except β in the glioma specimen.
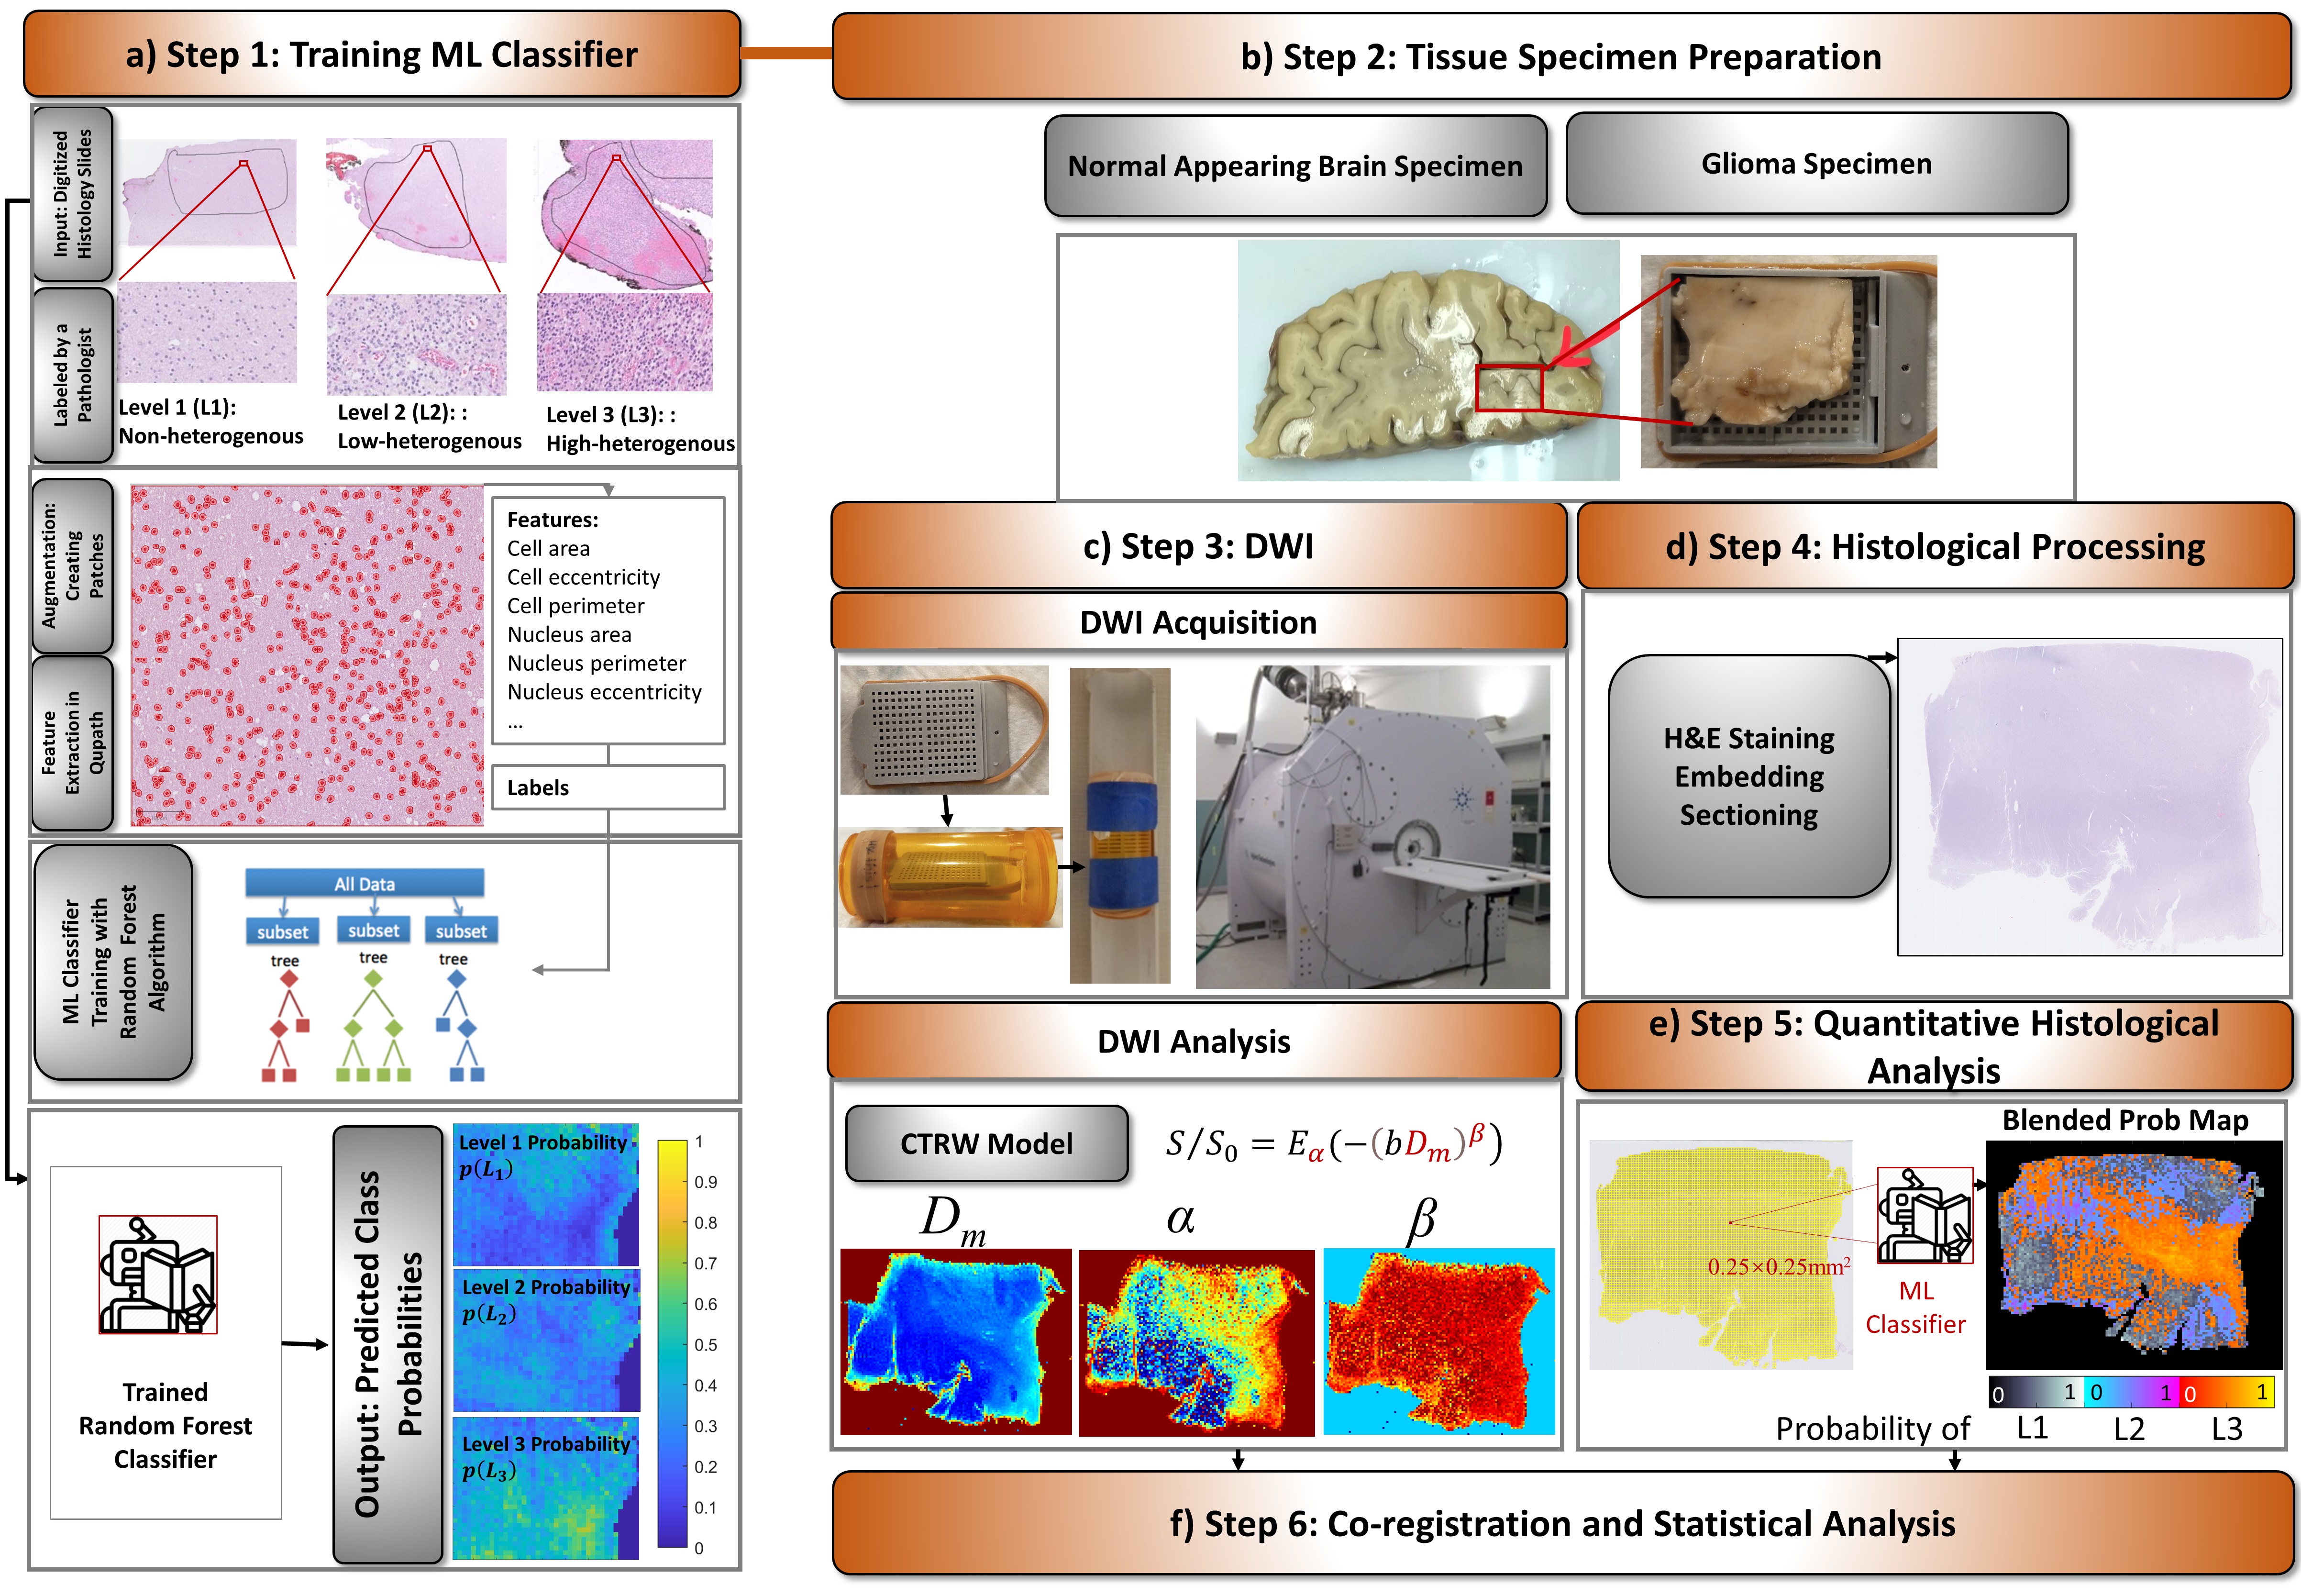
Figure 1: Workflow of the study.
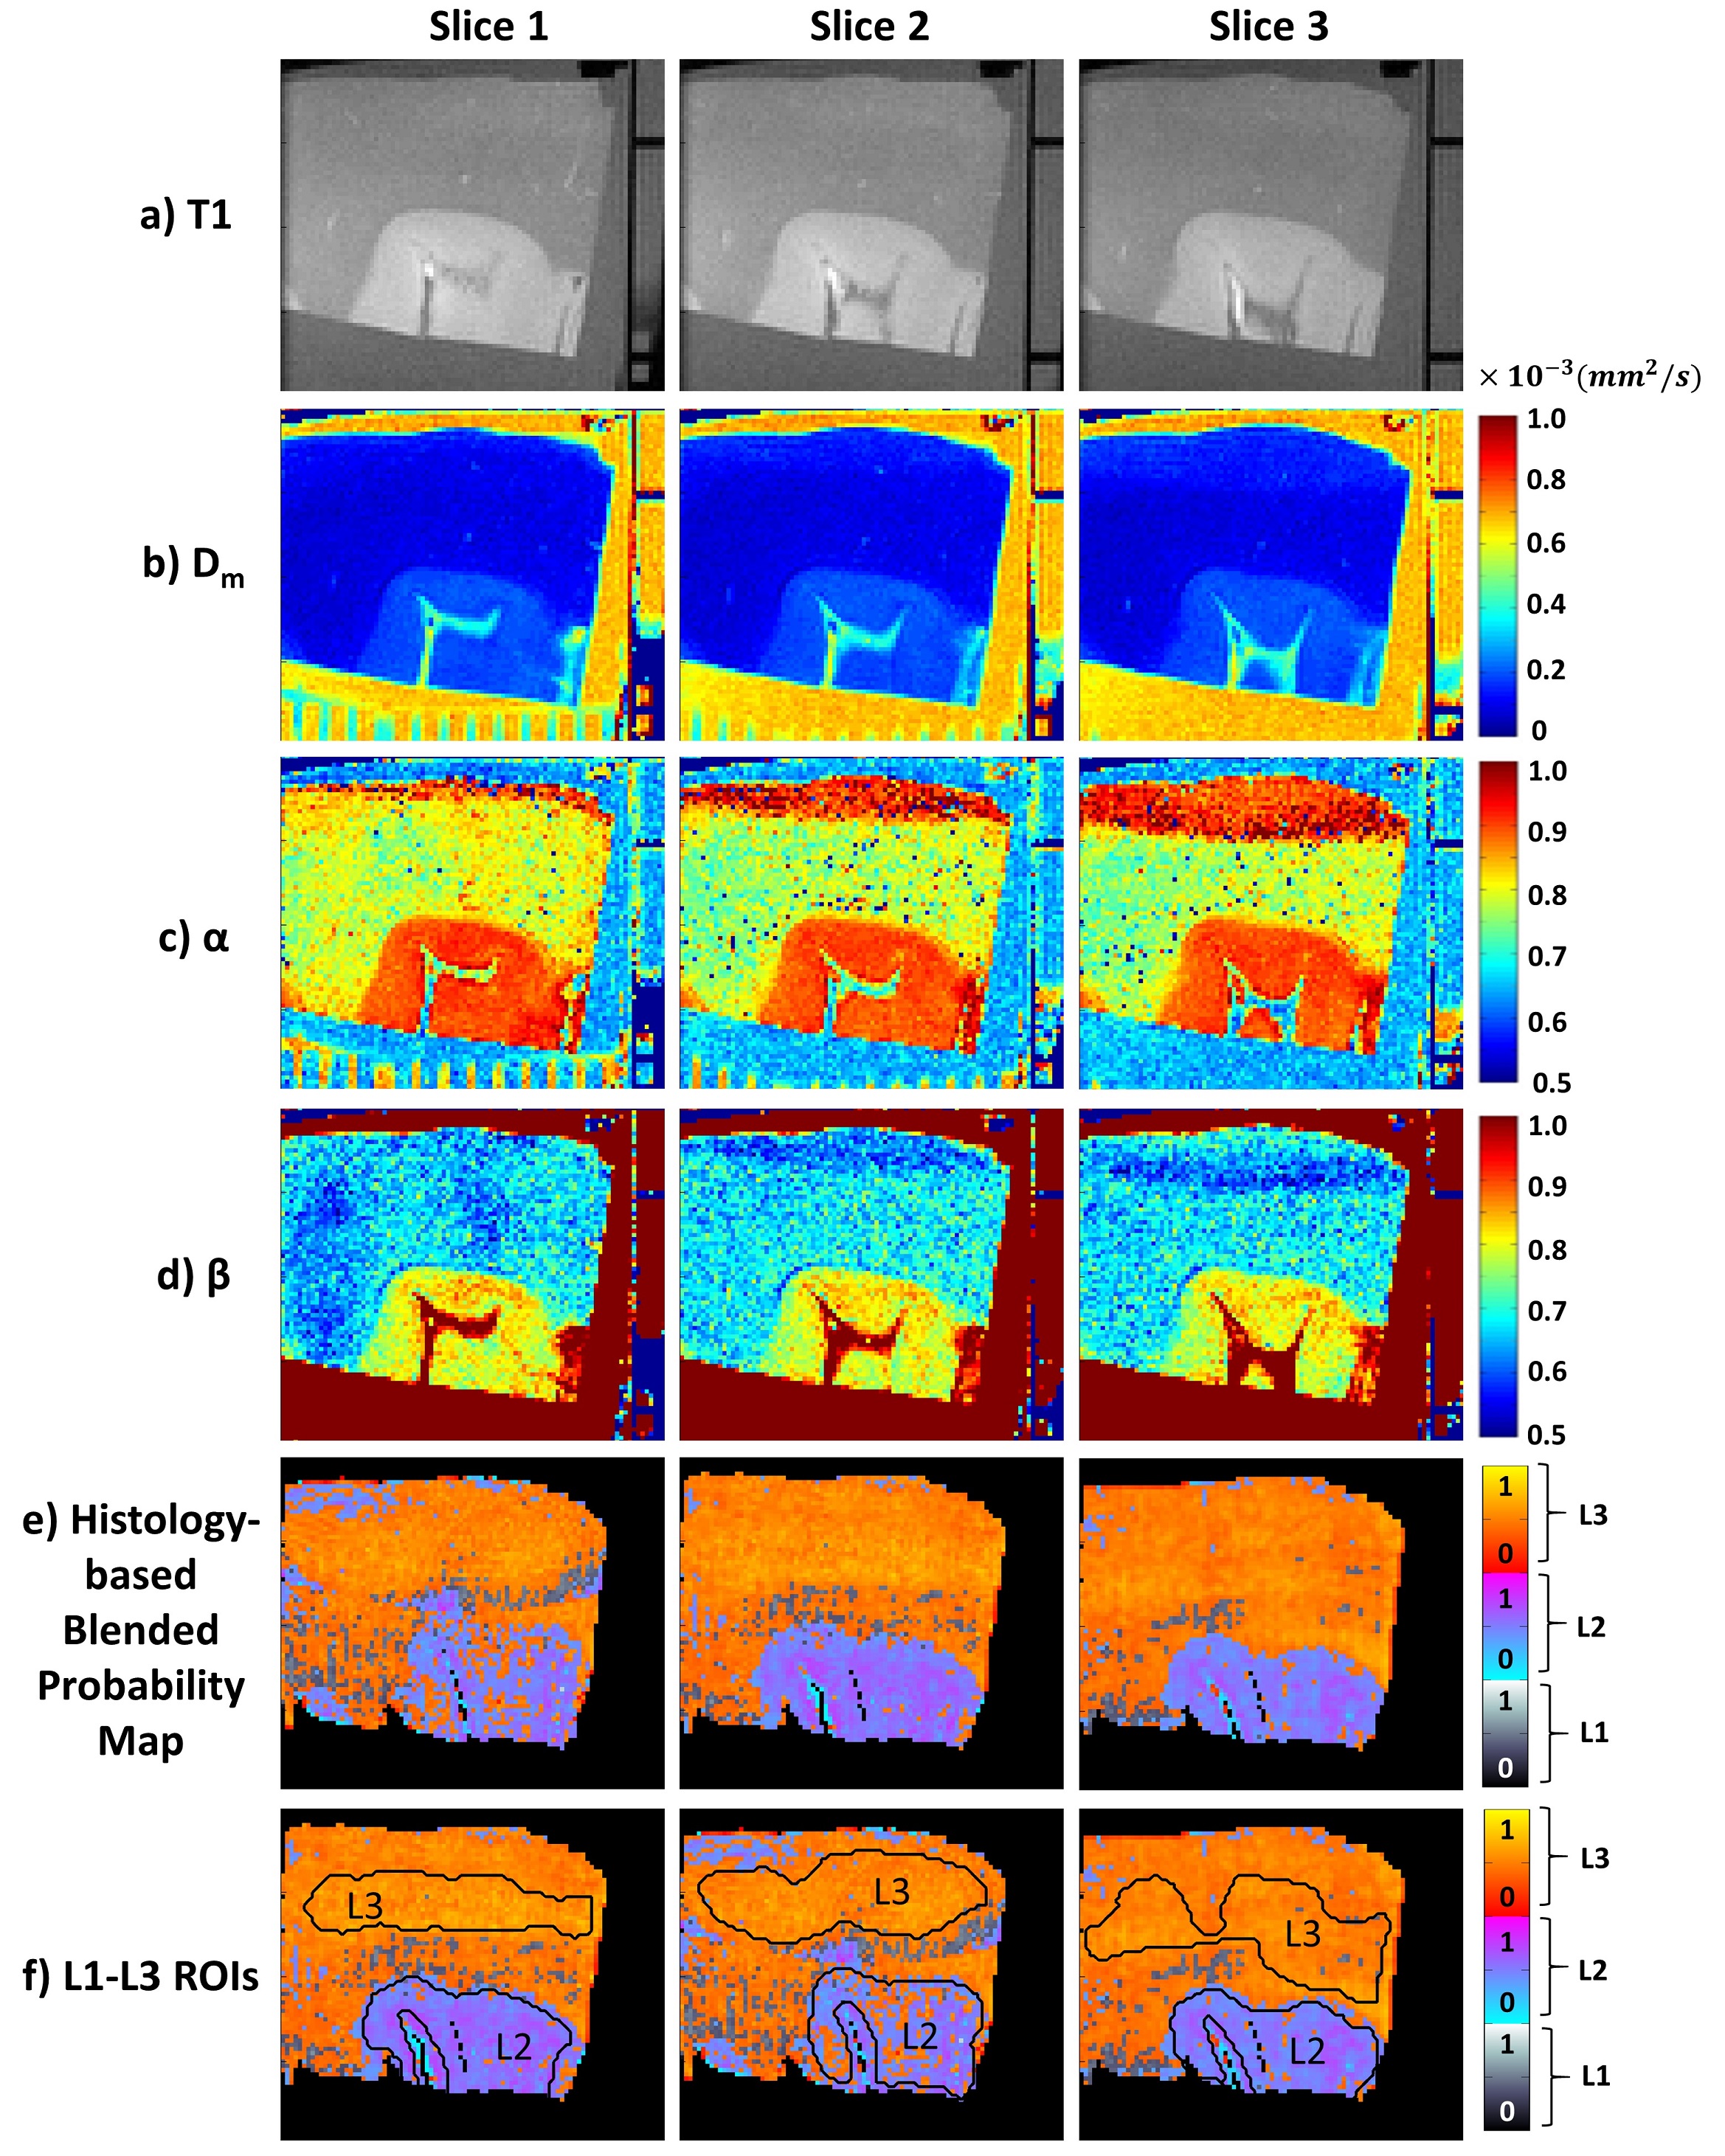
Figure 3: T1 image in a), CTRW
maps, Dm (in mm2/msec) in b),
α in c), β in d), and co-registered histology-based blended probability
maps in e) for three representative slices from the NAs. The blended
probability maps in e) were generated by determining the “assigned”
heterogeneity level (AHL) as the one with the highest probability; and
displaying AHL’s probability with a customized color bar. For example, a yellow
pixel with a value of 0.90 was predicted to have a heterogeneity level of L3
with a 90% probability. The L2
and L3 ROIs given in f) were drawn with the guidance of AHLs.