REGIS OTAVIANO FRANCA BEZERRA1, Hae Won Lee2, Gustavo Kaneblai3, Eduardo Figueiredo3, Mitsuharu Miyoshi4, Thomas Doring3, Claudia da Costa Leite5, Giovanni Guido Cerri2, and Frederico Perego Costa6
1RADIOLOGY, HOSPITAL SÍRIO-LIBANÊS, SAO PAULO, Brazil, 2Radiology, Hospital Sírio-Libanês, Sao Paulo, Brazil, 3General Eletric, Sao Paulo, Brazil, 4General Eletric, Tokyo, Japan, 5RADIOLOGIA, HOSPITAL SÍRIO-LIBANÊS, SAO PAULO, Brazil, 6Oncology, Hospital Sírio-Libanês, Sao Paulo, Brazil
1RADIOLOGY, HOSPITAL SÍRIO-LIBANÊS, SAO PAULO, Brazil, 2Radiology, Hospital Sírio-Libanês, Sao Paulo, Brazil, 3General Eletric, Sao Paulo, Brazil, 4General Eletric, Tokyo, Japan, 5RADIOLOGIA, HOSPITAL SÍRIO-LIBANÊS, SAO PAULO, Brazil, 6Oncology, Hospital Sírio-Libanês, Sao Paulo, Brazil
The glucose signals measured by MTRasym and dynamic glucoCEST mean AUC values are significantly different in cancer and normal white matter in 3T for primary brain tumors
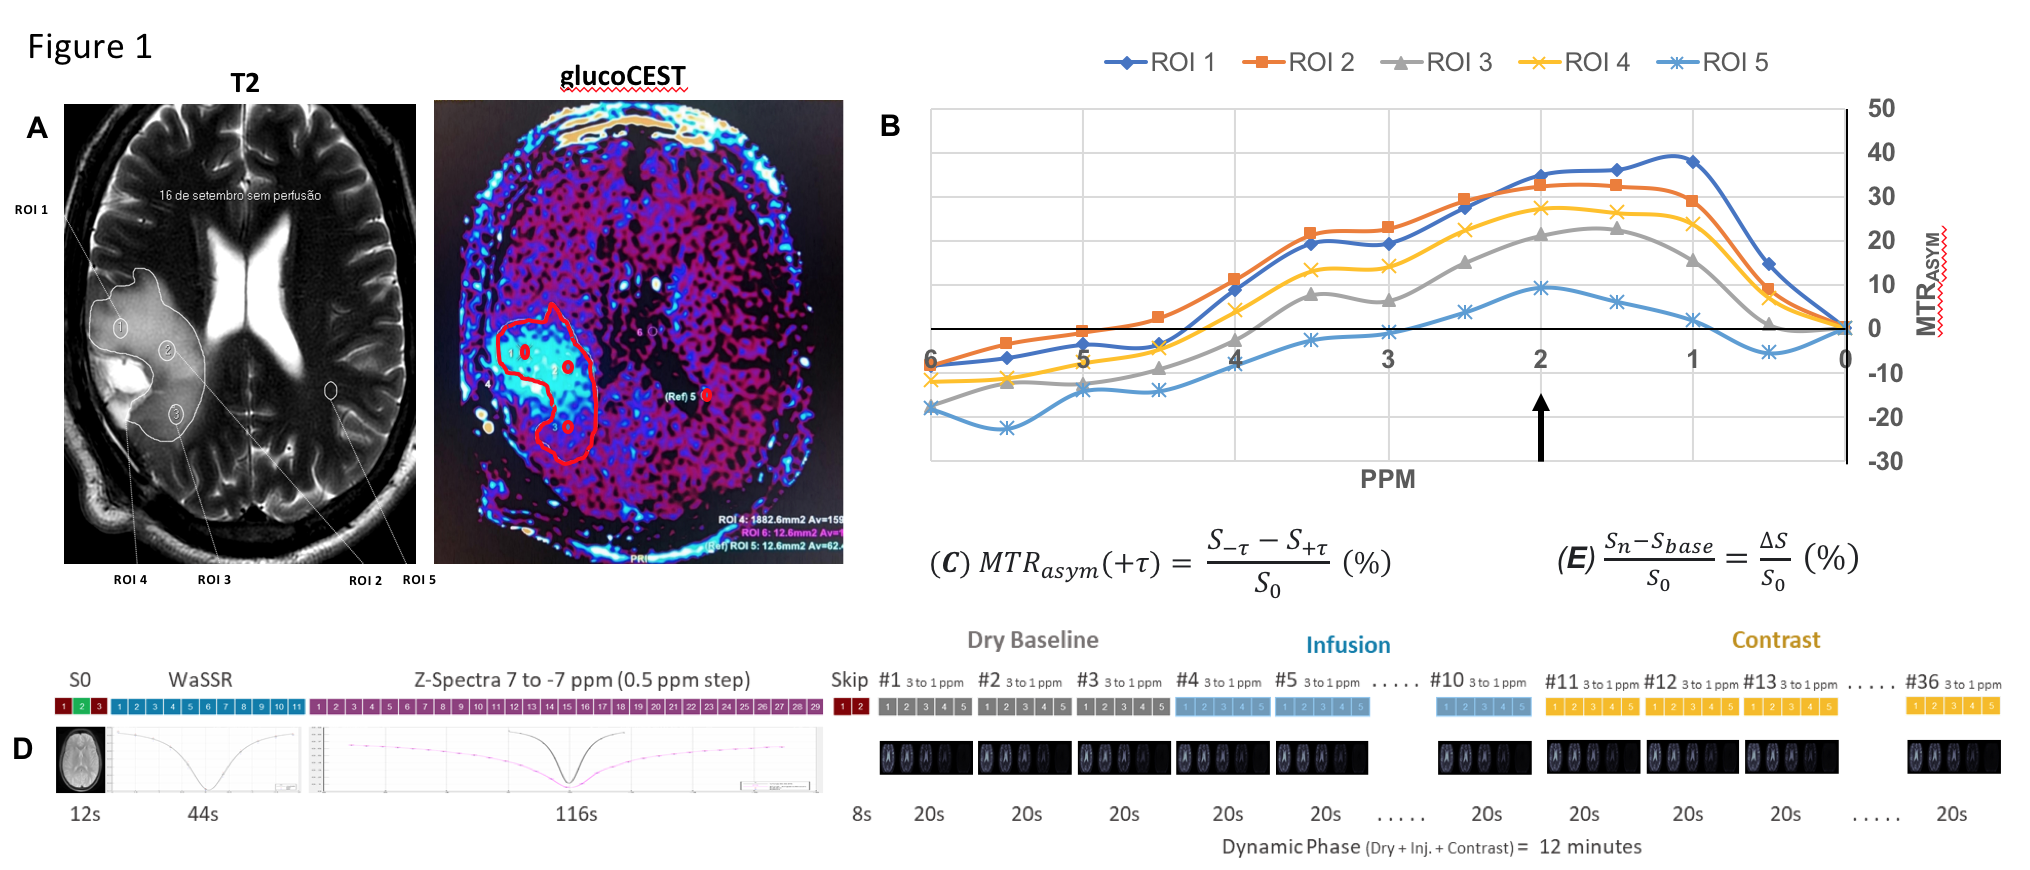
Fig1.Neuroradiologist outlined 5 regions of interest (ROI)(A).Motion correction was done prior to B0 calculation. The signal % at 2 ppm was determined when B0 variation is lower than 1 ppm (B). The MTRasym at2 ppm represents the GlucoCEST signal (C). Dynamic DRY, INFUSION, CONTRAST acquired 20, 35 and 130 images respectively in 3 phases, each with 5 images, ranging from +3 to -1 ppm (D). Average of the 3 DRY phases generated a reference signal Sbase. INFUSION and CONTRAST acquired Sn images (E).
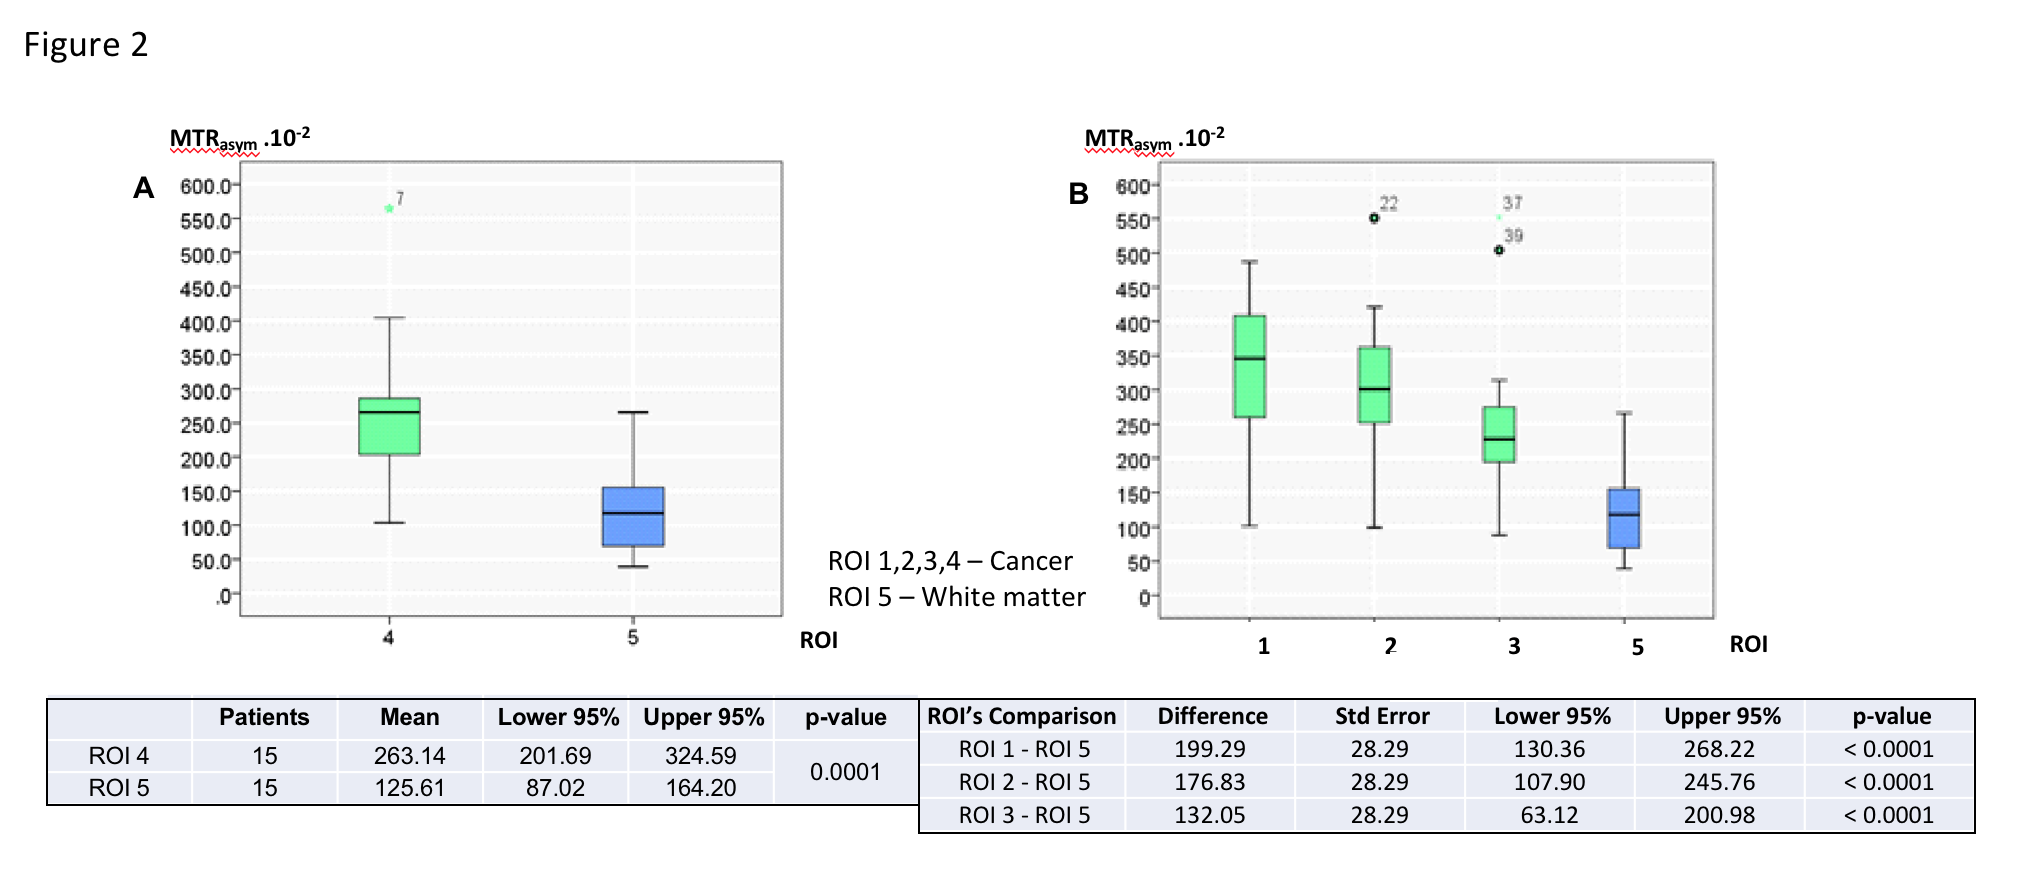
Fig2.Mean MTRasym values from 15 patients with brain tumours were significantly higher in ROI 4 than in ROI 5 (ANOVA and TukeyHSD test) (A). The mean MTRasym values from ROI 1 to3 were significantly different from ROI 5 in the same 15 patients (ANOVA and Dunnetttest) (B).