Ravi Prakash Reddy Nanga1, Elizabeth A Rosenfeld2, Deepa Thakuri1, Mark Elliott1, Ravinder Reddy1, and Diva D De Leon2
1Radiology, University of Pennsylvania, Philadelphia, PA, United States, 2Endocrinology and Diabetes, Children’s Hospital of Philadelphia, Philadelphia, PA, United States
1Radiology, University of Pennsylvania, Philadelphia, PA, United States, 2Endocrinology and Diabetes, Children’s Hospital of Philadelphia, Philadelphia, PA, United States
Higher GluCEST contrast was observed on the lateral side of the hippocampus when compared to the contralateral side. The mean difference in GluCEST was 1.92% in nine subjects who have completed participation thus far.

Figure 2: The top panel consists of an overlay of GluCEST map for the entire slice (left), followed by the overlay of only hippocampal ROIs (middle) and the corresponding T1map of the slice from MP2RAGE (right) from a male (top) and two female volunteers (center, bottom).
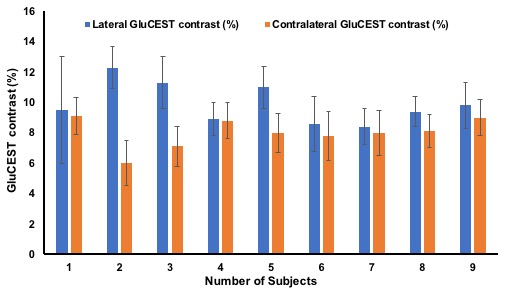
Figure 1: GluCEST contrast values from the ROIs drawn on hippocampus of all the nine subjects as well as their rearranged values from hippocampus based on the side where GluCEST contrast was higher (termed as Lateral) and the other side (termed as Contralateral).