Chen Liu1, David Jing Ma2, Nanyan Zhu3, Kay Igwe2, Jochen Weber2, Roshell Li4, Emily Turner Wood5, Wafae Labriji6, Vasile Stupar6, Yanping Sun7, Neil Harris8, Antoine Depaulis6, Florence Fauvelle 9, Scott A. Small10,11,12, Douglas L. Rothman13, and Jia Guo10,14
1Department of Electrical Engineering and the Taub Institute, Columbia University, New York, NY, United States, 2Columbia University, New York, NY, United States, 3Department of Biological Sciences and the Taub Institute, Columbia University, New York, NY, United States, 4Department of Biomedical Engineering, Columbia University, New York, NY, United States, 5University of California, Los Angeles, Los Angeles, CA, United States, 6Grenoble Institut Neurosciences (GIN), Grenoble, France, 7Herbert Irving Comprehensive Cancer Centre, Columbia University, New York, NY, United States, 8Department of Neurosurgery, University of California, Los Angeles, Los Angeles, CA, United States, 9Grenoble MRI Facility IRMaGe, France, France, 10Department of Psychiatry, Columbia University, New York, NY, United States, 11Department of Neurology, Columbia University, New York, NY, United States, 12Taub Institute for Research on Alzheimer's Disease and the Aging Brain, Columbia University, New York, NY, United States, 13Radiology and Biomedical Imaging and of Biomedical Engineering, Yale University, New Haven, CT, United States, 14Mortimer B. Zuckerman Mind Brain Behavior Institute, Columbia University, New York, NY, United States
1Department of Electrical Engineering and the Taub Institute, Columbia University, New York, NY, United States, 2Columbia University, New York, NY, United States, 3Department of Biological Sciences and the Taub Institute, Columbia University, New York, NY, United States, 4Department of Biomedical Engineering, Columbia University, New York, NY, United States, 5University of California, Los Angeles, Los Angeles, CA, United States, 6Grenoble Institut Neurosciences (GIN), Grenoble, France, 7Herbert Irving Comprehensive Cancer Centre, Columbia University, New York, NY, United States, 8Department of Neurosurgery, University of California, Los Angeles, Los Angeles, CA, United States, 9Grenoble MRI Facility IRMaGe, France, France, 10Department of Psychiatry, Columbia University, New York, NY, United States, 11Department of Neurology, Columbia University, New York, NY, United States, 12Taub Institute for Research on Alzheimer's Disease and the Aging Brain, Columbia University, New York, NY, United States, 13Radiology and Biomedical Imaging and of Biomedical Engineering, Yale University, New Haven, CT, United States, 14Mortimer B. Zuckerman Mind Brain Behavior Institute, Columbia University, New York, NY, United States
Jet helps data process
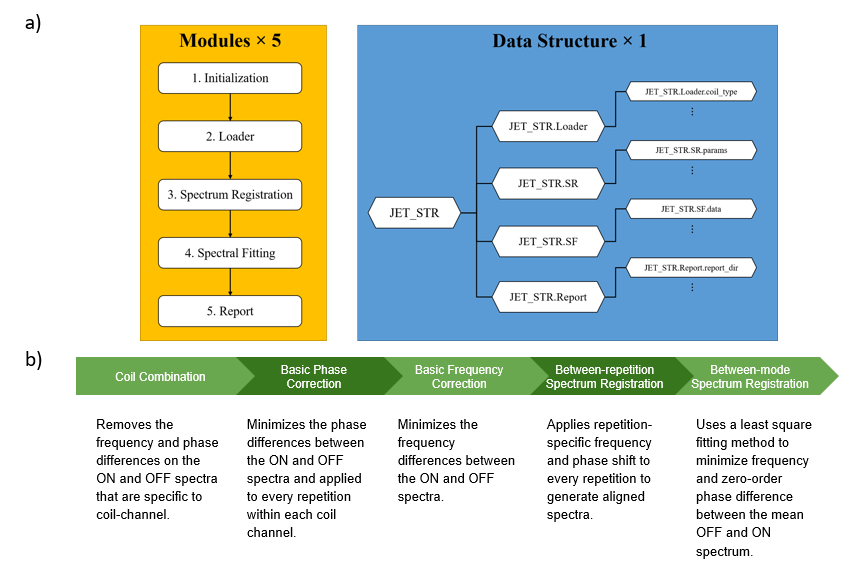
Figure 1: Overview of modules and data structures in JET. a) Image representation of the JET modules in sequential order and its data structures that exist to operate each module. b) Sequential order of spectrum registration correction within the third module. The main function of JET is operated in the spectrum registration module where parameter corrections will be performed on the incoming data to quantify metabolite concentration.
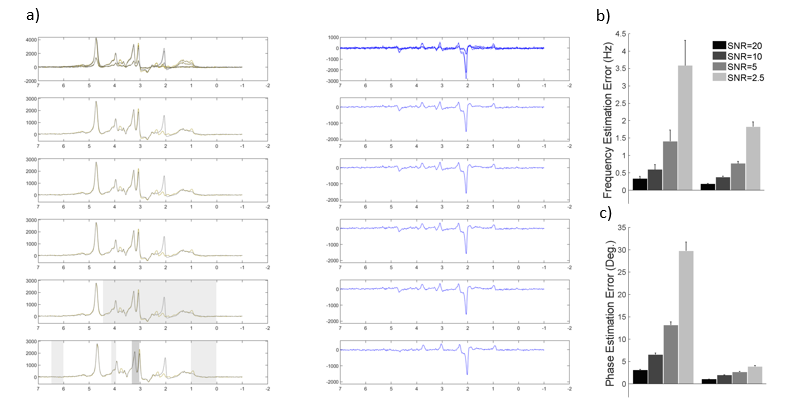
Figure 2: Spectrum registration correction using JET and its performance using error analysis for different signal noise ratios. a) Spectrum registration correction in sequential order of the spectras. It can be observed that after each correction, the DIFF spectra improves. b) Bar graph representation of frequency estimation error for different SNRs. c) Bar graph representation of phase estimation error for different SNRs. It can be observed that JET reduces both parameter errors with greater SNR.