Rui V Simoes1, Rafael N Henriques1, Beatriz M Cardoso1, Tania Carvalho1, and Noam Shemesh1
1Champalimaud Research, Champalimaud Foundation, Lisbon, Portugal
1Champalimaud Research, Champalimaud Foundation, Lisbon, Portugal
While aerobic glycolysis (Warburg effect) is a hallmark of
cancer, our results indicate glucose oxidation rate as a potential marker of cell proliferation and
vascular stability in a syngeneic mouse model of GBM, suggesting a new approach
for non-invasive phenotyping of
this disease.
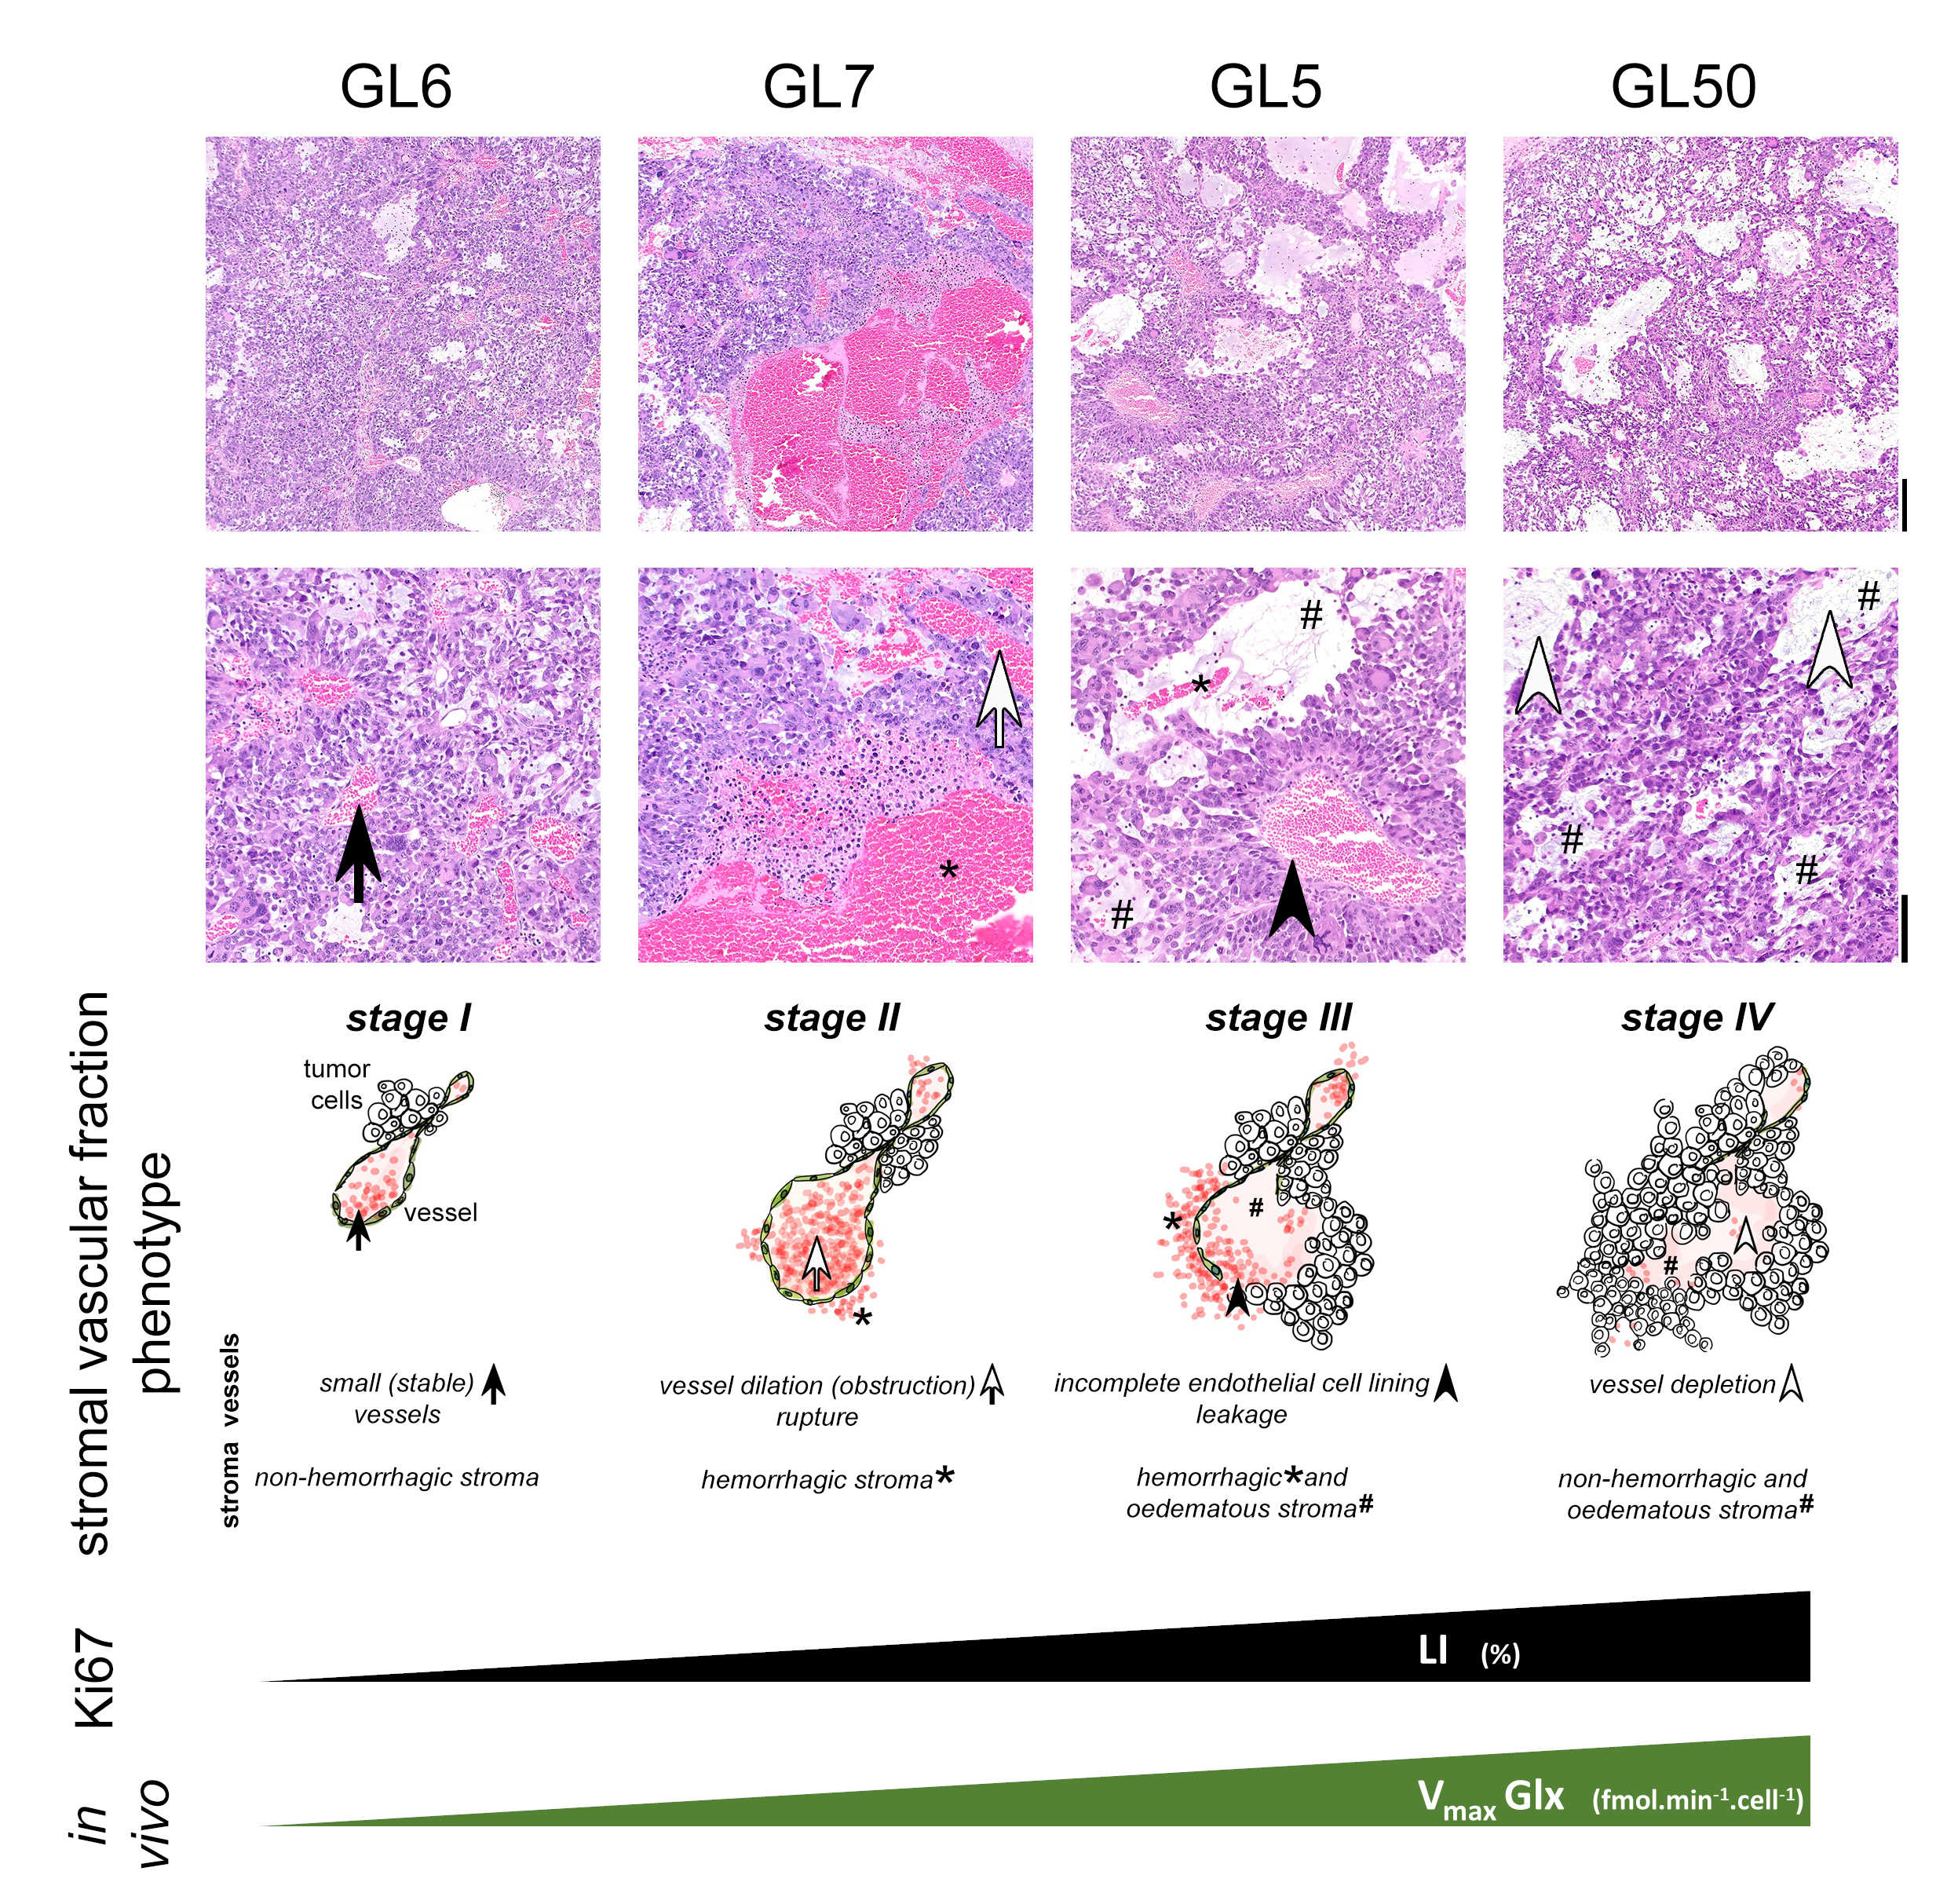
Figure 5 – Glucose oxidation rate as a potential marker for GBM
staging according to cell proliferation and stromal vascular fraction
phenotype. H&E microphotographs showing how the expansile tumor
growth progressively compresses and impairs vascular blood flow: I, small vessels,
complete endothelial cell lining and sparse hemorrhages (GL6); II, blood flow obstructed,
vasodilation and marked multifocal hemorrhages (GL7); III, necrosis with
incomplete endothelial cell lining, vascular leakage, edematous stroma (GL5);
IV, vascular depletion, edematous stroma (GL50).
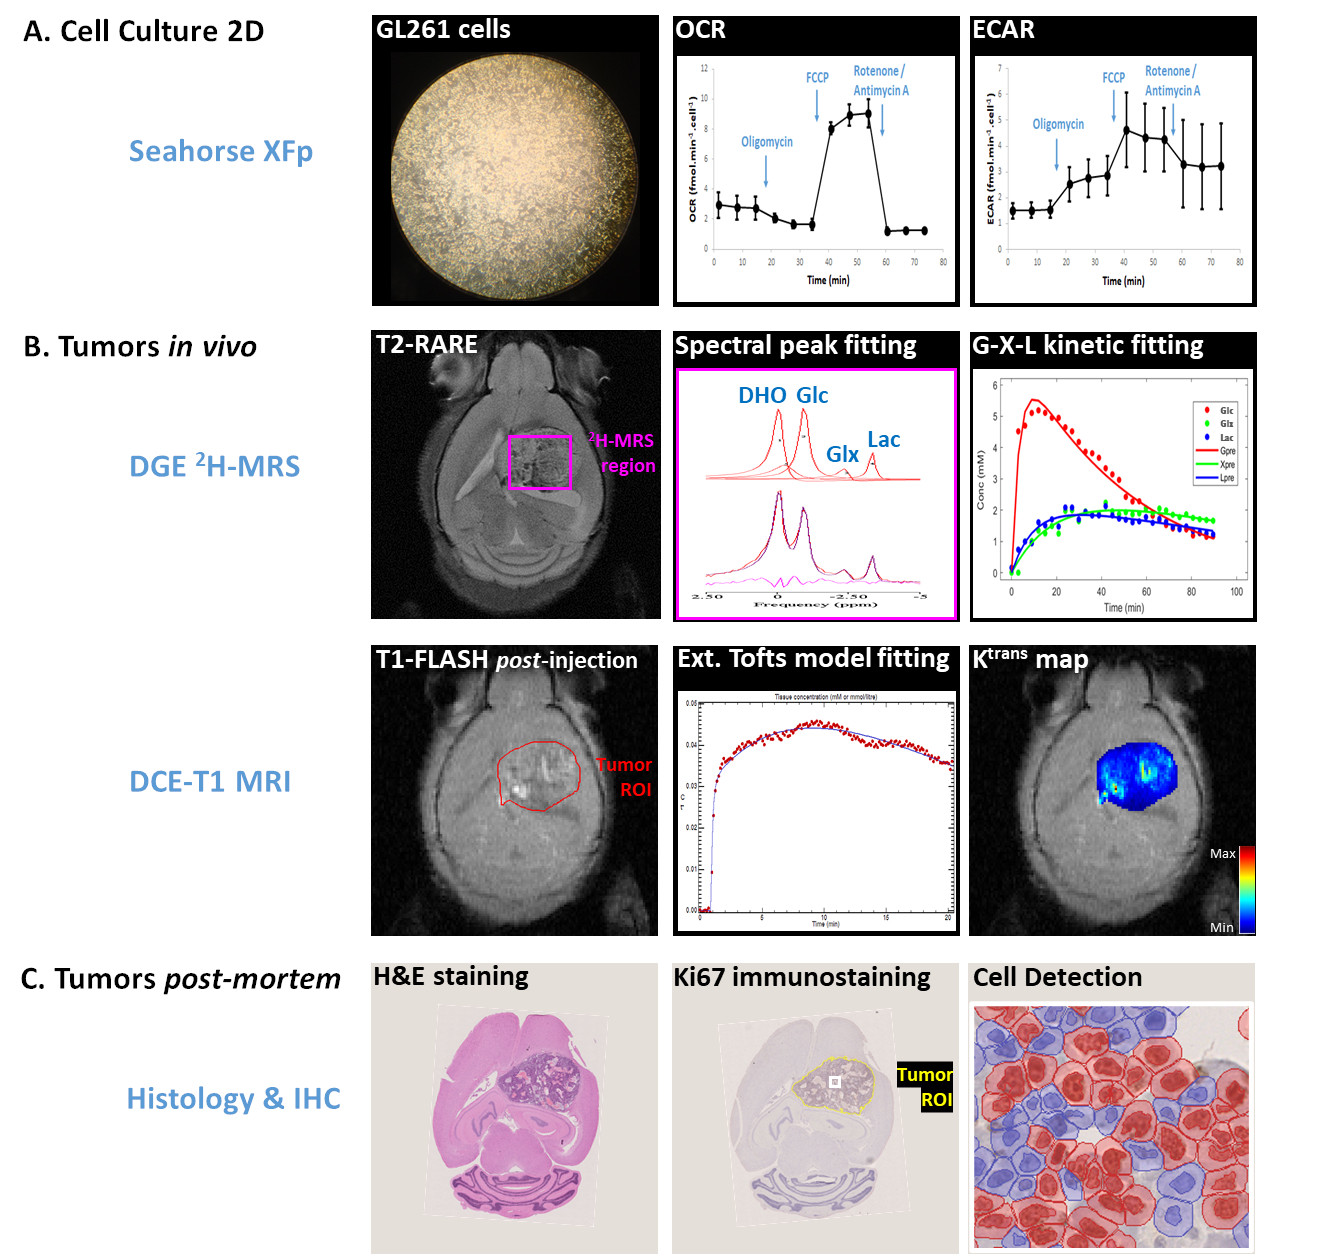
Figure 1 – Experimental
approach. A. in vitro, Seahorse XFp Mito-Stress
Test with
GL261 cells, measuring OCR and ECAR during sequential inhibition of the respiratory chain:
oligomycin (ATP synthase), FCCP (H+ uncoupler), and antimycin A/rotenone
(complexes I/III). B. in vivo, DGE 2H-MRS,
showing the volume selection (pink), spectral fitting for each metabolite and
the kinetic fitting; and DCE-T1 MRI, showing the tumor ROI (red), kinetic fitting
and Ktrans maps. C. post-mortem, Tumor histology for
H&E and Ki67 – enlarged region showing Ki67 positive (red) and negative
(blue) cells.