Yae Won Park1, Ji Eun Park2, Sung Soo Ahn1, Seung Hong Choi3, Ho Sung Kim2, and Seung-Koo Lee1
1Yonsei University College of Medicine, Seoul, Korea, Republic of, 2University of Ulsan College of Medicine, Seoul, Korea, Republic of, 3Seoul National University Hospital, Seoul, Korea, Republic of
1Yonsei University College of Medicine, Seoul, Korea, Republic of, 2University of Ulsan College of Medicine, Seoul, Korea, Republic of, 3Seoul National University Hospital, Seoul, Korea, Republic of
Infiltrative or mixed pattern, lower ADC, lower 5th percentile of ADC, and higher 95th percentile of nCBF may be useful imaging biomarkers for the EGFR amplification of IDHwt LGGs.
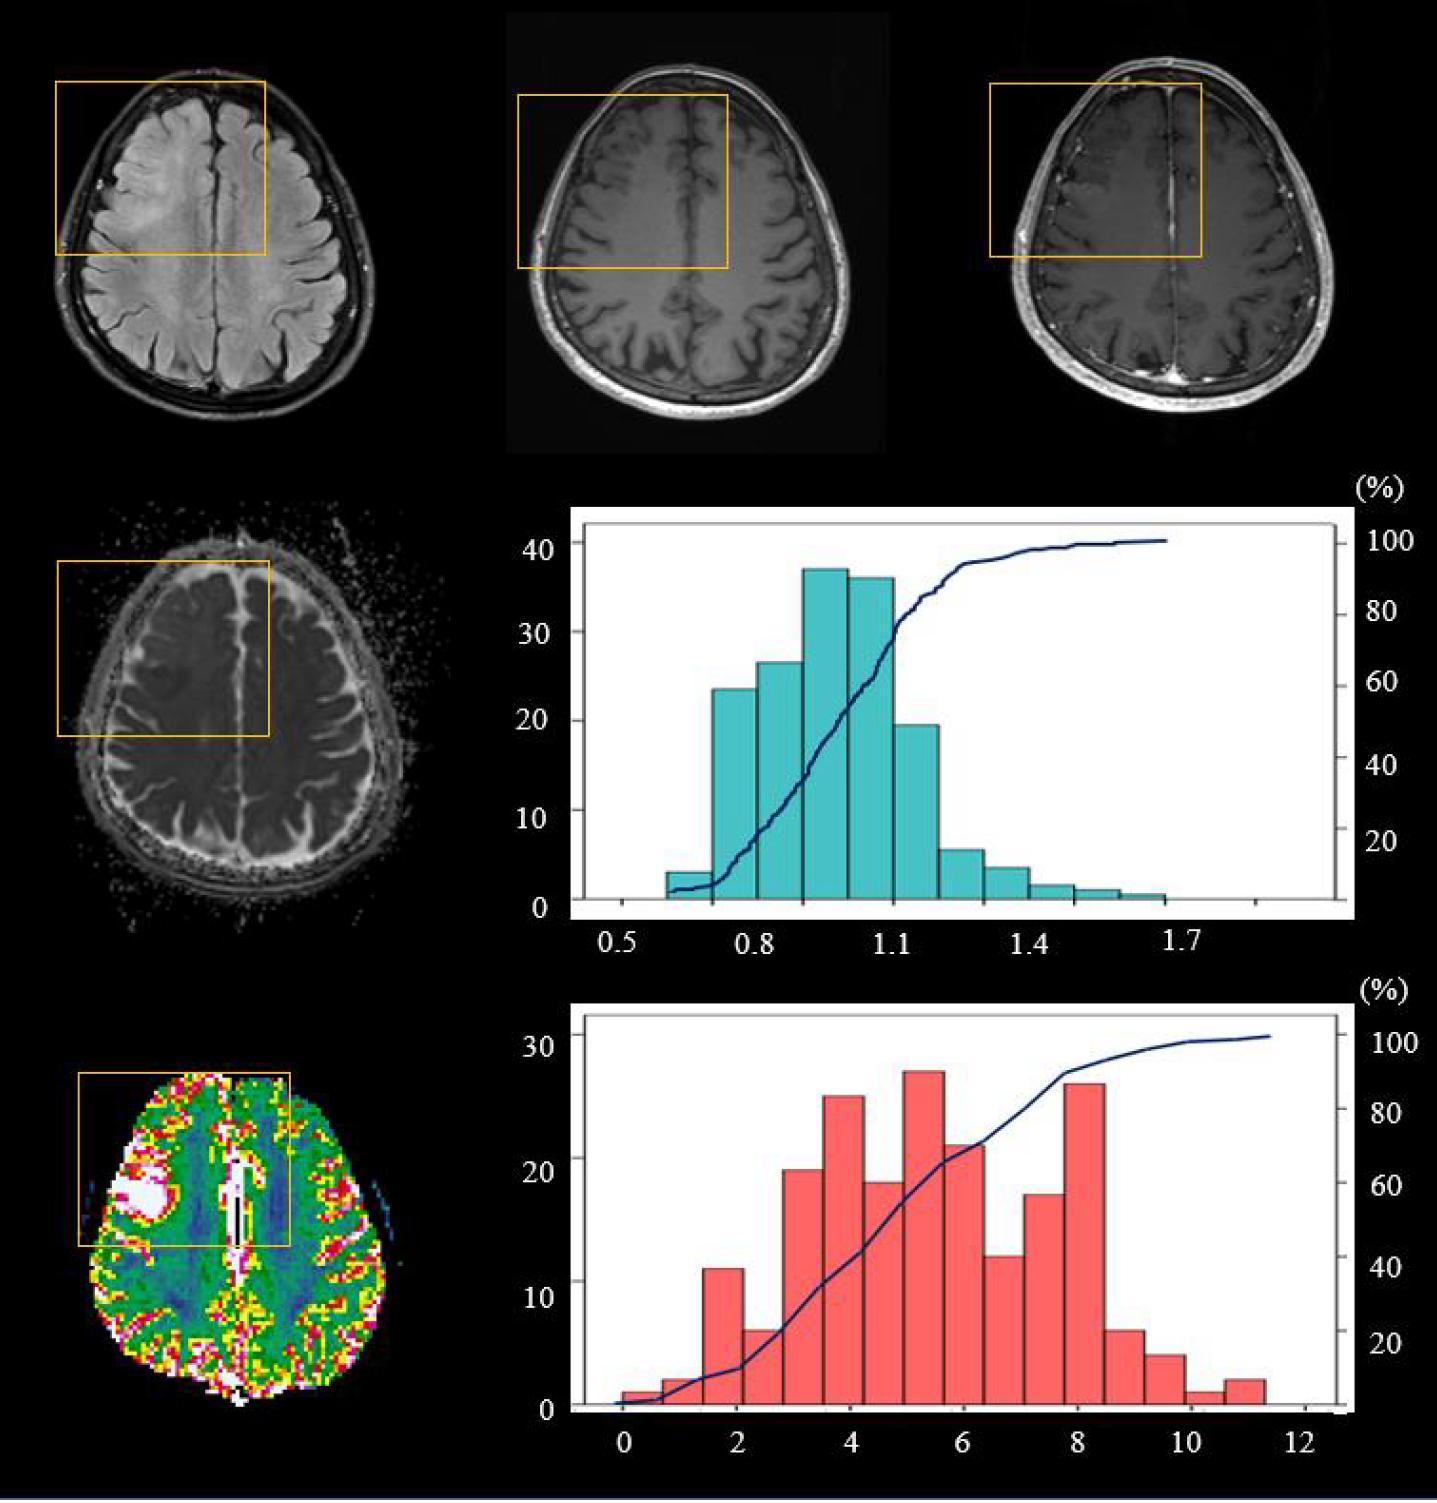
Figure 1. Images
of a 75-year-old female with an EGFR amplified grade III IDHwt glioma reveals
T2 hyperintense tumor in the right frontal lobe, showing an infiltrative pattern
(size of precontrast T1 abnormality much smaller than size of FLAIR
abnormality). The histogram and cumulative histogram (dark blue line) of ADC
shows a 5th percentile DC value and mean ADC value of 0.60 x 10⁻³
mm2/s and 1.01 x 10⁻³ mm2/s, respectively. The
histogram and cumulative histogram (dark blue line) of nCBF shows a 95th
percentile of the nCBF value of 7.54.
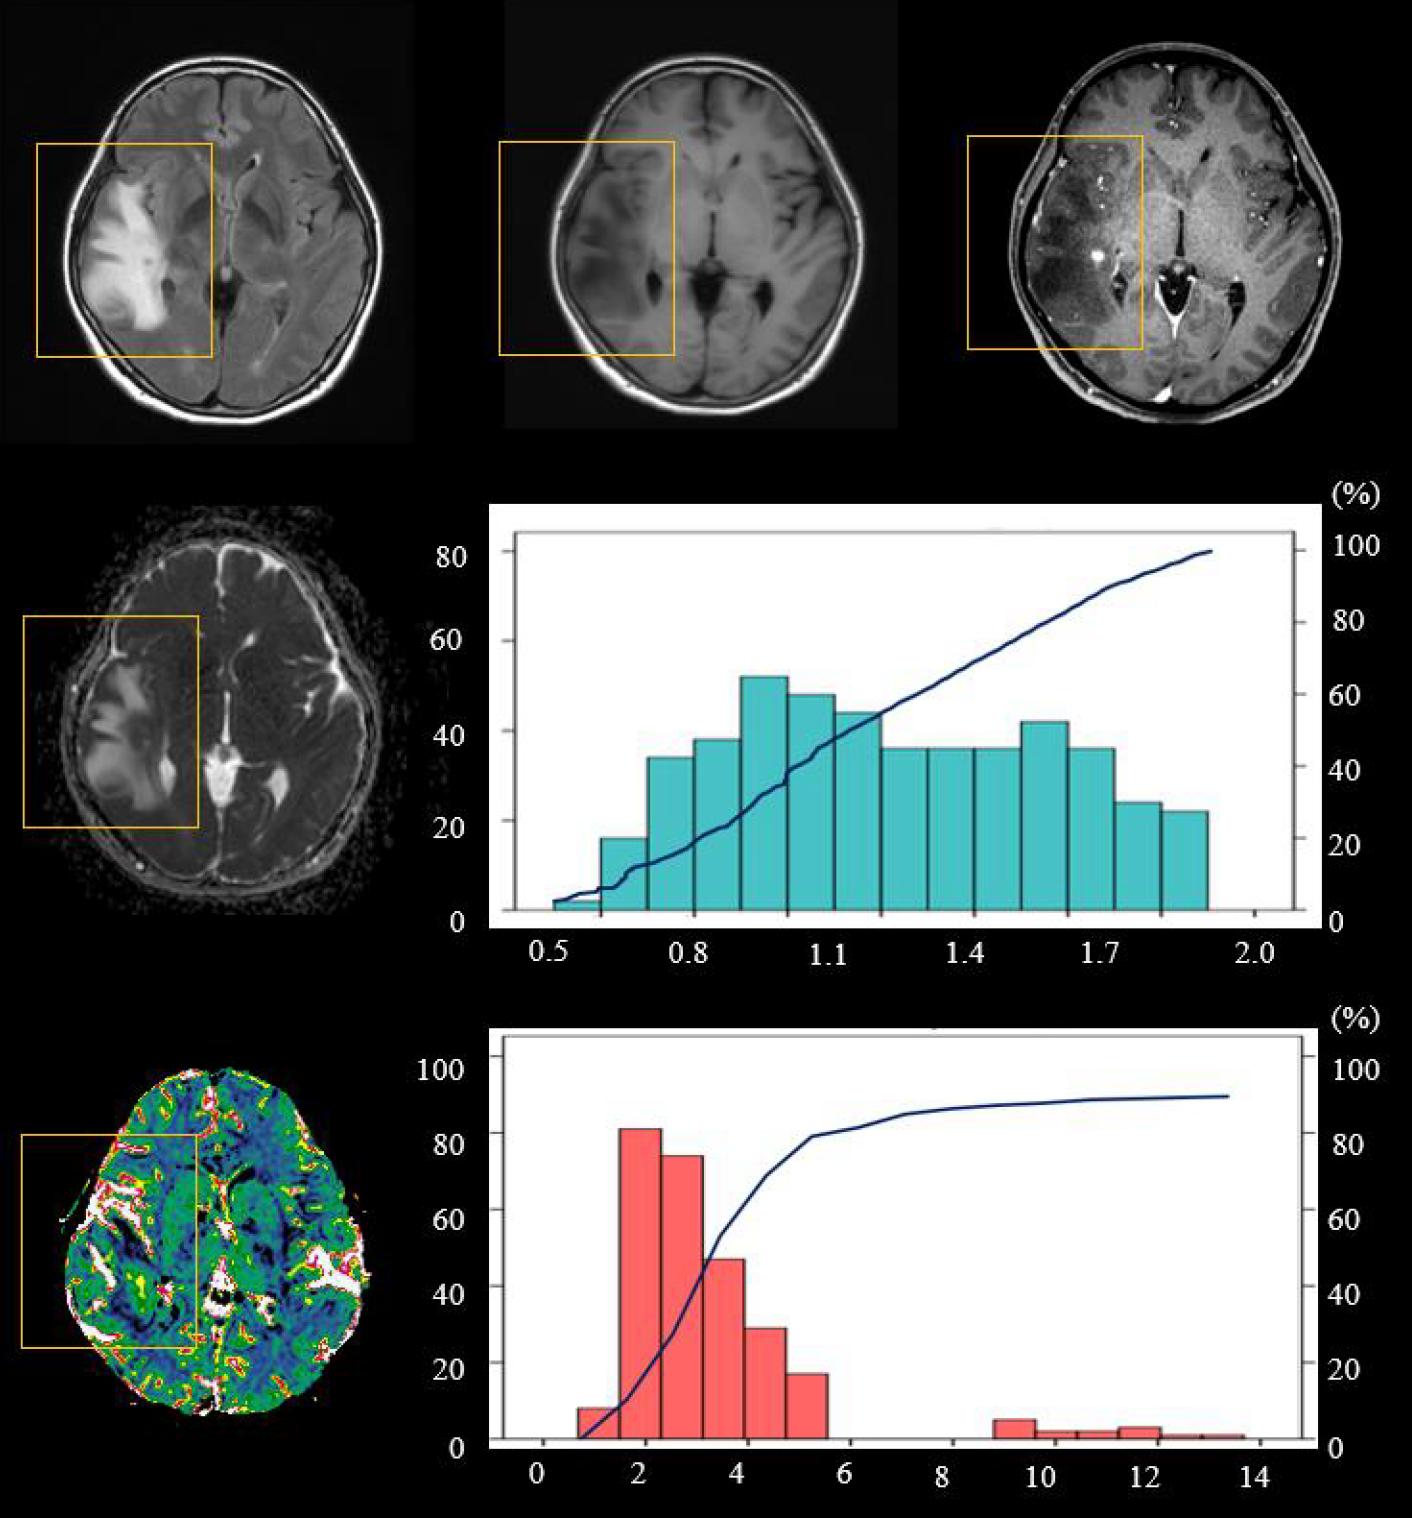
Figure 2. Images of a 58-year-old female
with an EGFR non-amplified grade III IDHwt glioma reveals T2 hyperintense tumor
in the left temporal lobe, showing an expansile pattern (size of precontrast T1
abnormality approximates size of FLAIR abnormality). The histogram and
cumulative histogram (dark blue line) of ADC shows a 5th percentile
ADC value and mean ADC value of 0.73 x 10⁻³ mm2/s and 1.28
x 10-3 mm2/s, respectively. The histogram and cumulative histogram
(dark blue line) of nCBF shows a 95th percentile of the nCBF value
of 4.55.