Chaoyue Wang1, Benjamin C. Tendler1, Stephen M. Smith1, Fidel Alfaro-Almagro1, Alberto Llera2, Cristiana Fiscone3,4, Richard Bowtell3, Lloyd T. Elliott5, Karla L. Miller1, and Aurea B. Martins-Bach1
1Wellcome Centre for Integrative Neuroimaging, FMRIB, Nuffield Department of Clinical Neurosciences, University of Oxford, Oxford, United Kingdom, 2Donders Institute for Brain, Cognition and Behaviour, Radboud University Nijmegen, Nijmegen, Netherlands, 3Sir Peter Mansfield Imaging Centre, School of Physics and Astronomy, University of Nottingham, Nottingham, United Kingdom, 4Department of Biomedical and Neuromotor Sciences, University of Bologna, Bologna, Italy, 5Department of Statistics and Actuarial Science, Simon Fraser University, Vancouver, BC, Canada
1Wellcome Centre for Integrative Neuroimaging, FMRIB, Nuffield Department of Clinical Neurosciences, University of Oxford, Oxford, United Kingdom, 2Donders Institute for Brain, Cognition and Behaviour, Radboud University Nijmegen, Nijmegen, Netherlands, 3Sir Peter Mansfield Imaging Centre, School of Physics and Astronomy, University of Nottingham, Nottingham, United Kingdom, 4Department of Biomedical and Neuromotor Sciences, University of Bologna, Bologna, Italy, 5Department of Statistics and Actuarial Science, Simon Fraser University, Vancouver, BC, Canada
MR susceptibility estimates are associated with genetic loci involved in a range of biological functions including iron, calcium, myelin, brain development, immune system and general regulation of cell function.
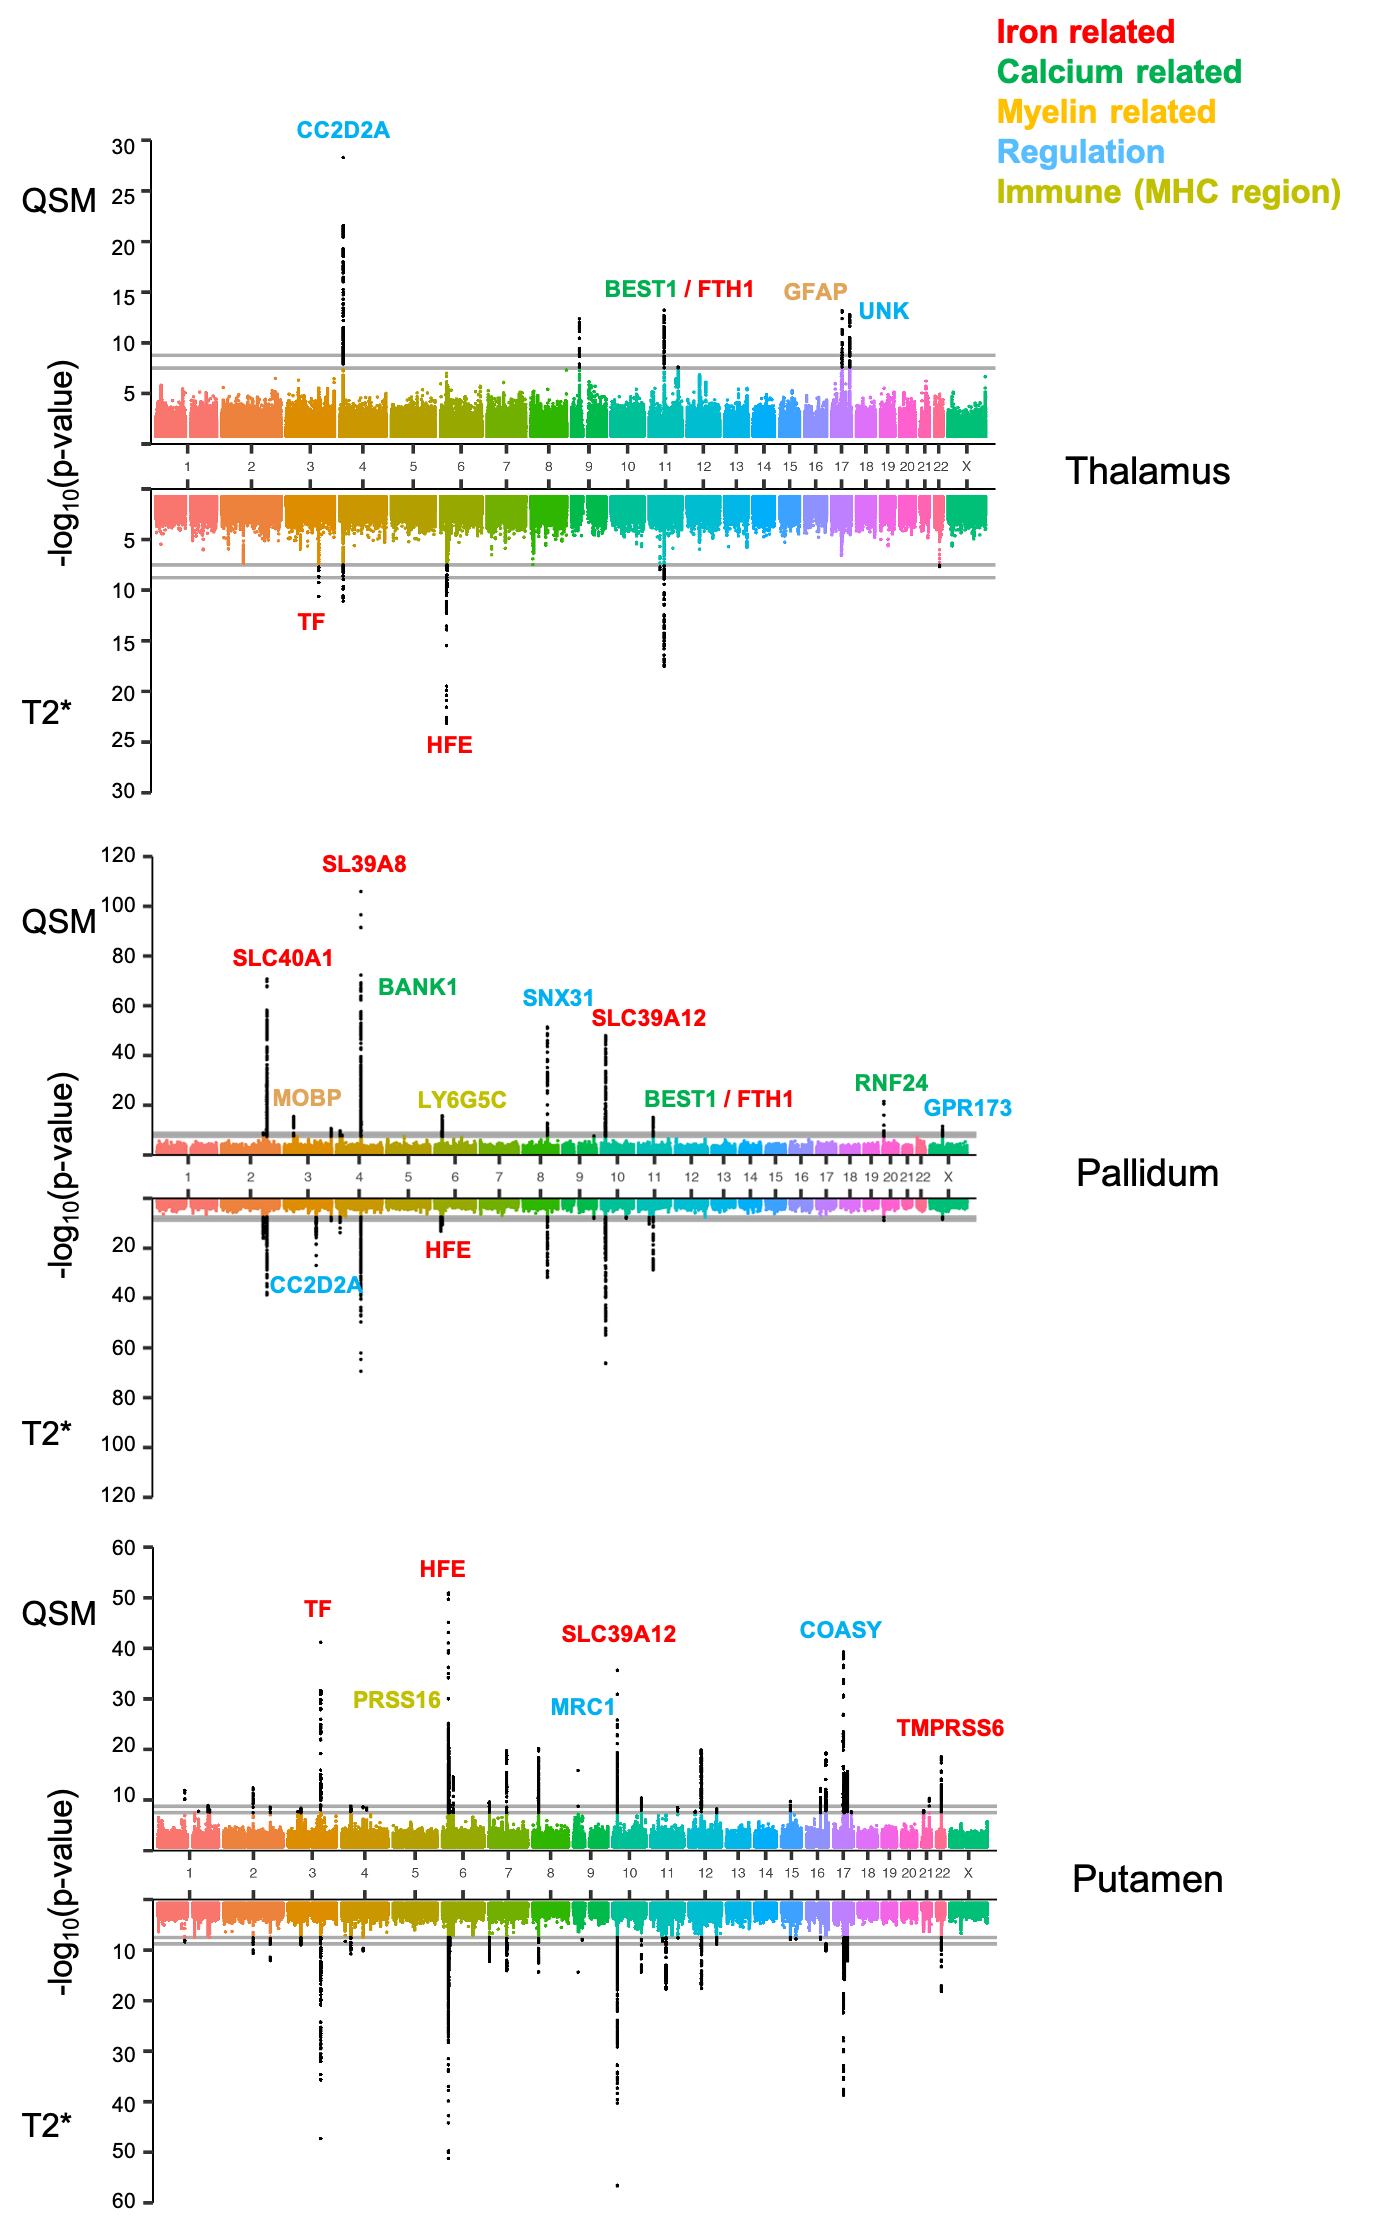
Figure 1 Manhattan plots comparing GWAS associations with QSM and T2* (reversed) IDPs in thalamus, pallidum and putamen. Here, the x-axis shows the SNPs (sorted by chromosome), with the y-axis revealing the significance level. Hits passing significance threshold (two grey horizontal lines) are in black. Selected lead SNPs in each genetic locus were labelled with names of the related gene and colour-coded for different biological functions involved. Common and distinct genetic loci are identified in these regions and between QSM and T2* IDPs (e.g. HFE – T2* and GFAP – QSM in Thalamus).
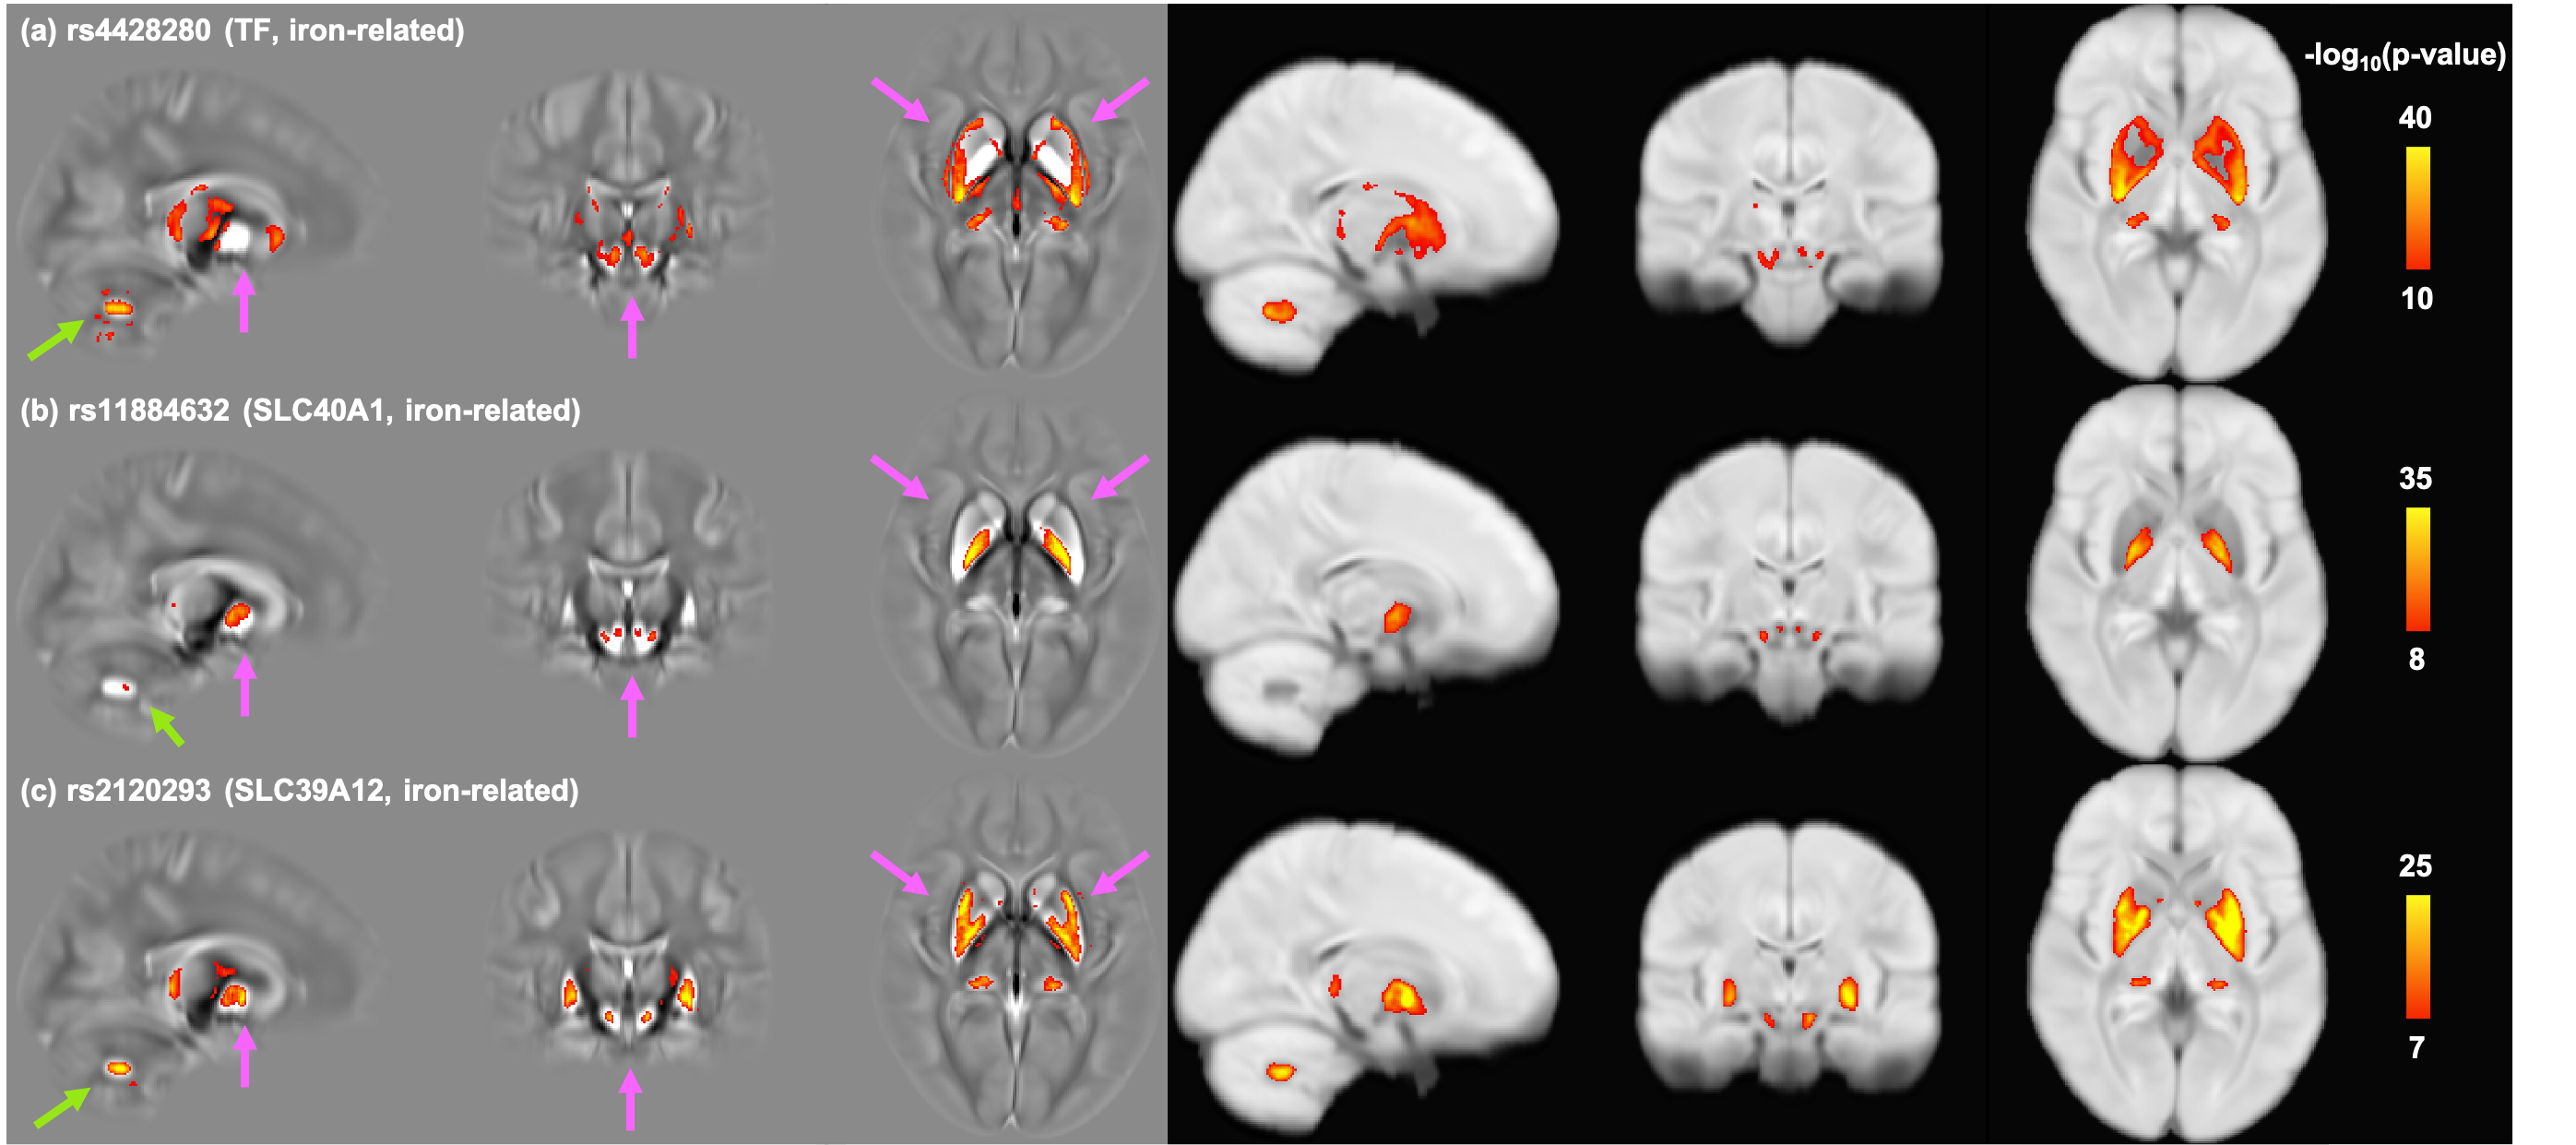
Figure 4 Voxel-wise correlation maps of 3 selected SNPs in genes related to iron homeostasis with susceptibility (left) and T2* (right) maps in MNI152 space. Colour overlays represent the strength of each voxel’s correlation. Susceptibility and T2* maps generally have similar spatial patterns of associations with these SNPs. These iron-related SNPs have very distinct spatial patterns of associations (purple arrows). Additional associated areas in the cerebellum (green arrows) were identified.