1School of Medicine, Queen's University, Kingston, ON, Canada, 2Center for Neuroscience Studies, Queen's University, Kingston, ON, Canada, 3Radiology, Weill Cornell Medicine, New York, NY, United States, 4Neurology, Beth Israel Deaconess Medical Center, Harvard Medical School, Boston, MA, United States, 5Neurosurgery, Beth Israel Deaconess Medical Center, Harvard Medical School, Boston, MA, United States, 6Radiology, Beth Israel Deaconess Medical Center, Harvard Medical School, Boston, MA, United States
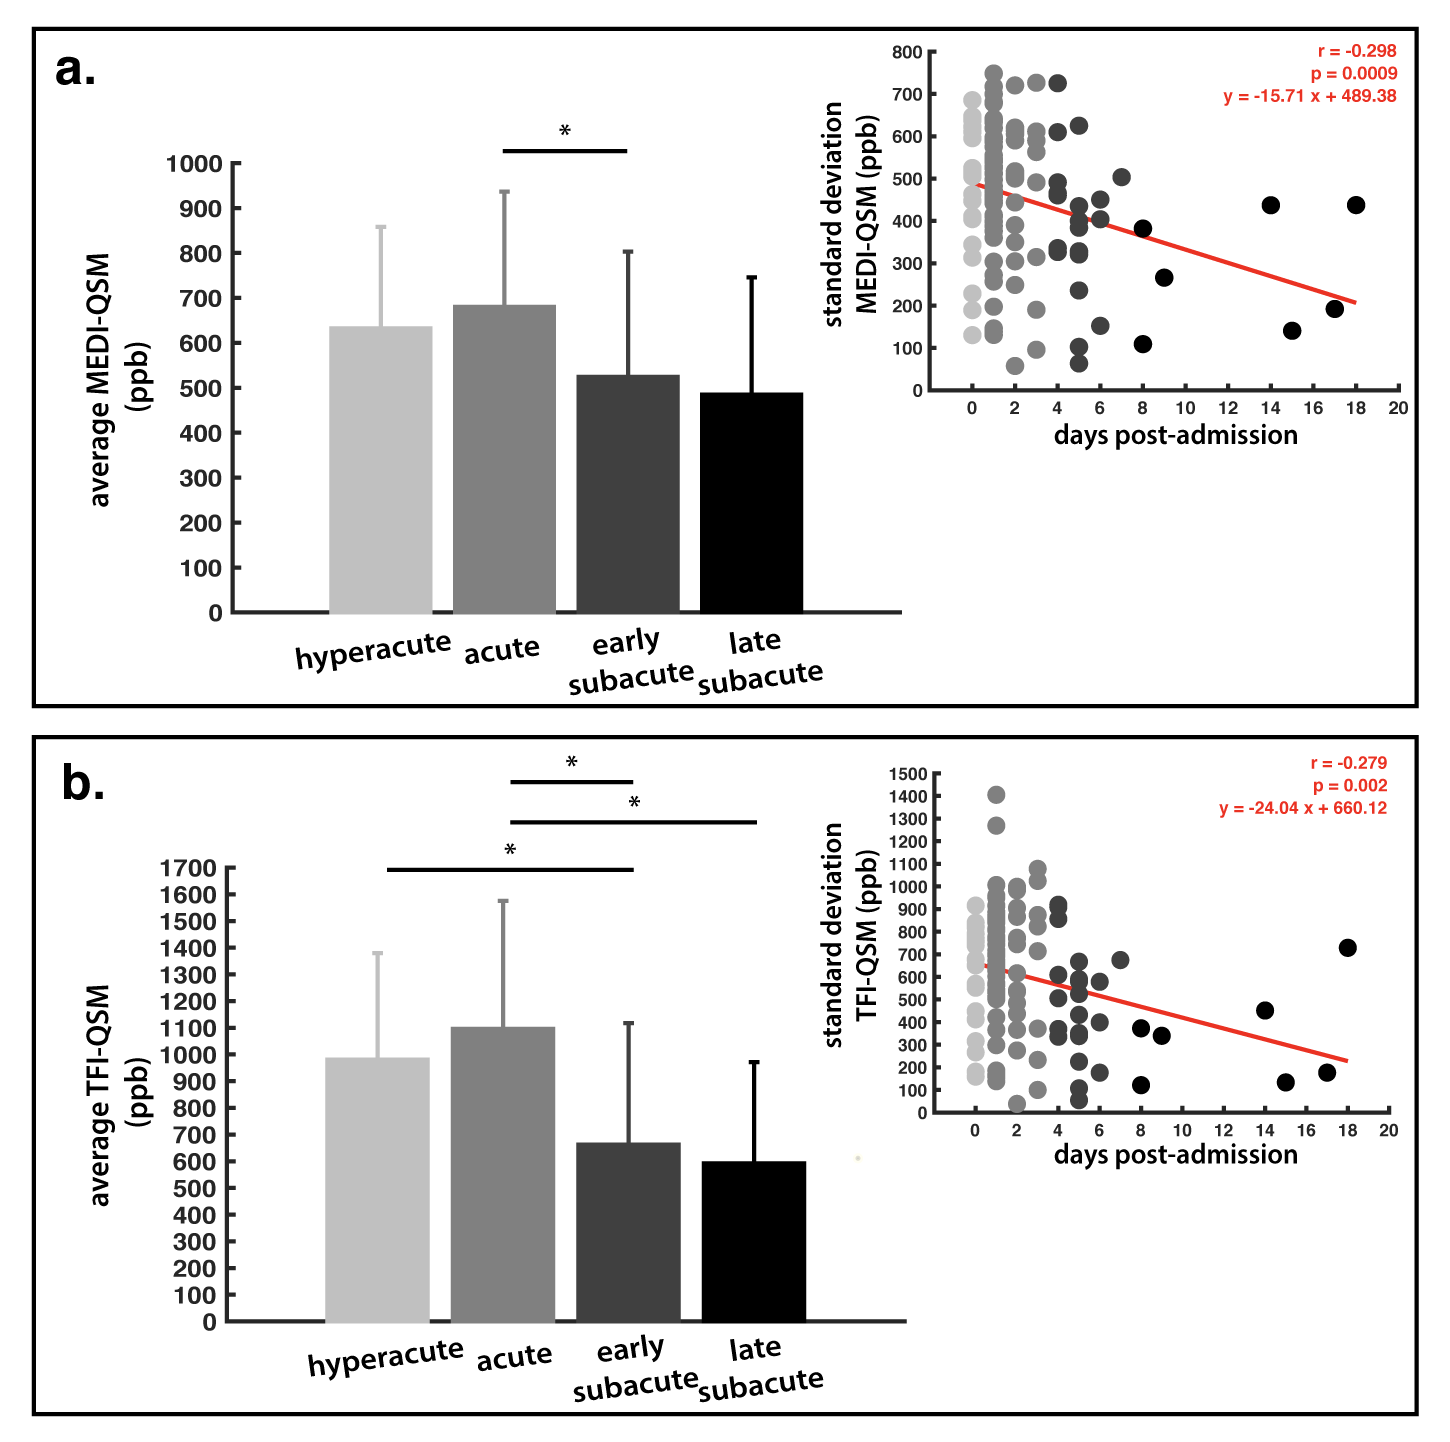
Figure 3. Statistical results
ANOVA results from comparisons of quantitative susceptibility mapping (QSM) within the segmented lesion based on the staging groups. The linear regression between the region of interest standard deviation (red line) and estimated days post-admission is shown (top corner). (a) Morphological Enabled Dipole Inversion (MEDI) method (PANOVA = 0.043), (b) Total Field Inversion (TFI) method (PANOVA = 0.0004). * = denotes statistical significance for post-hoc comparisons.
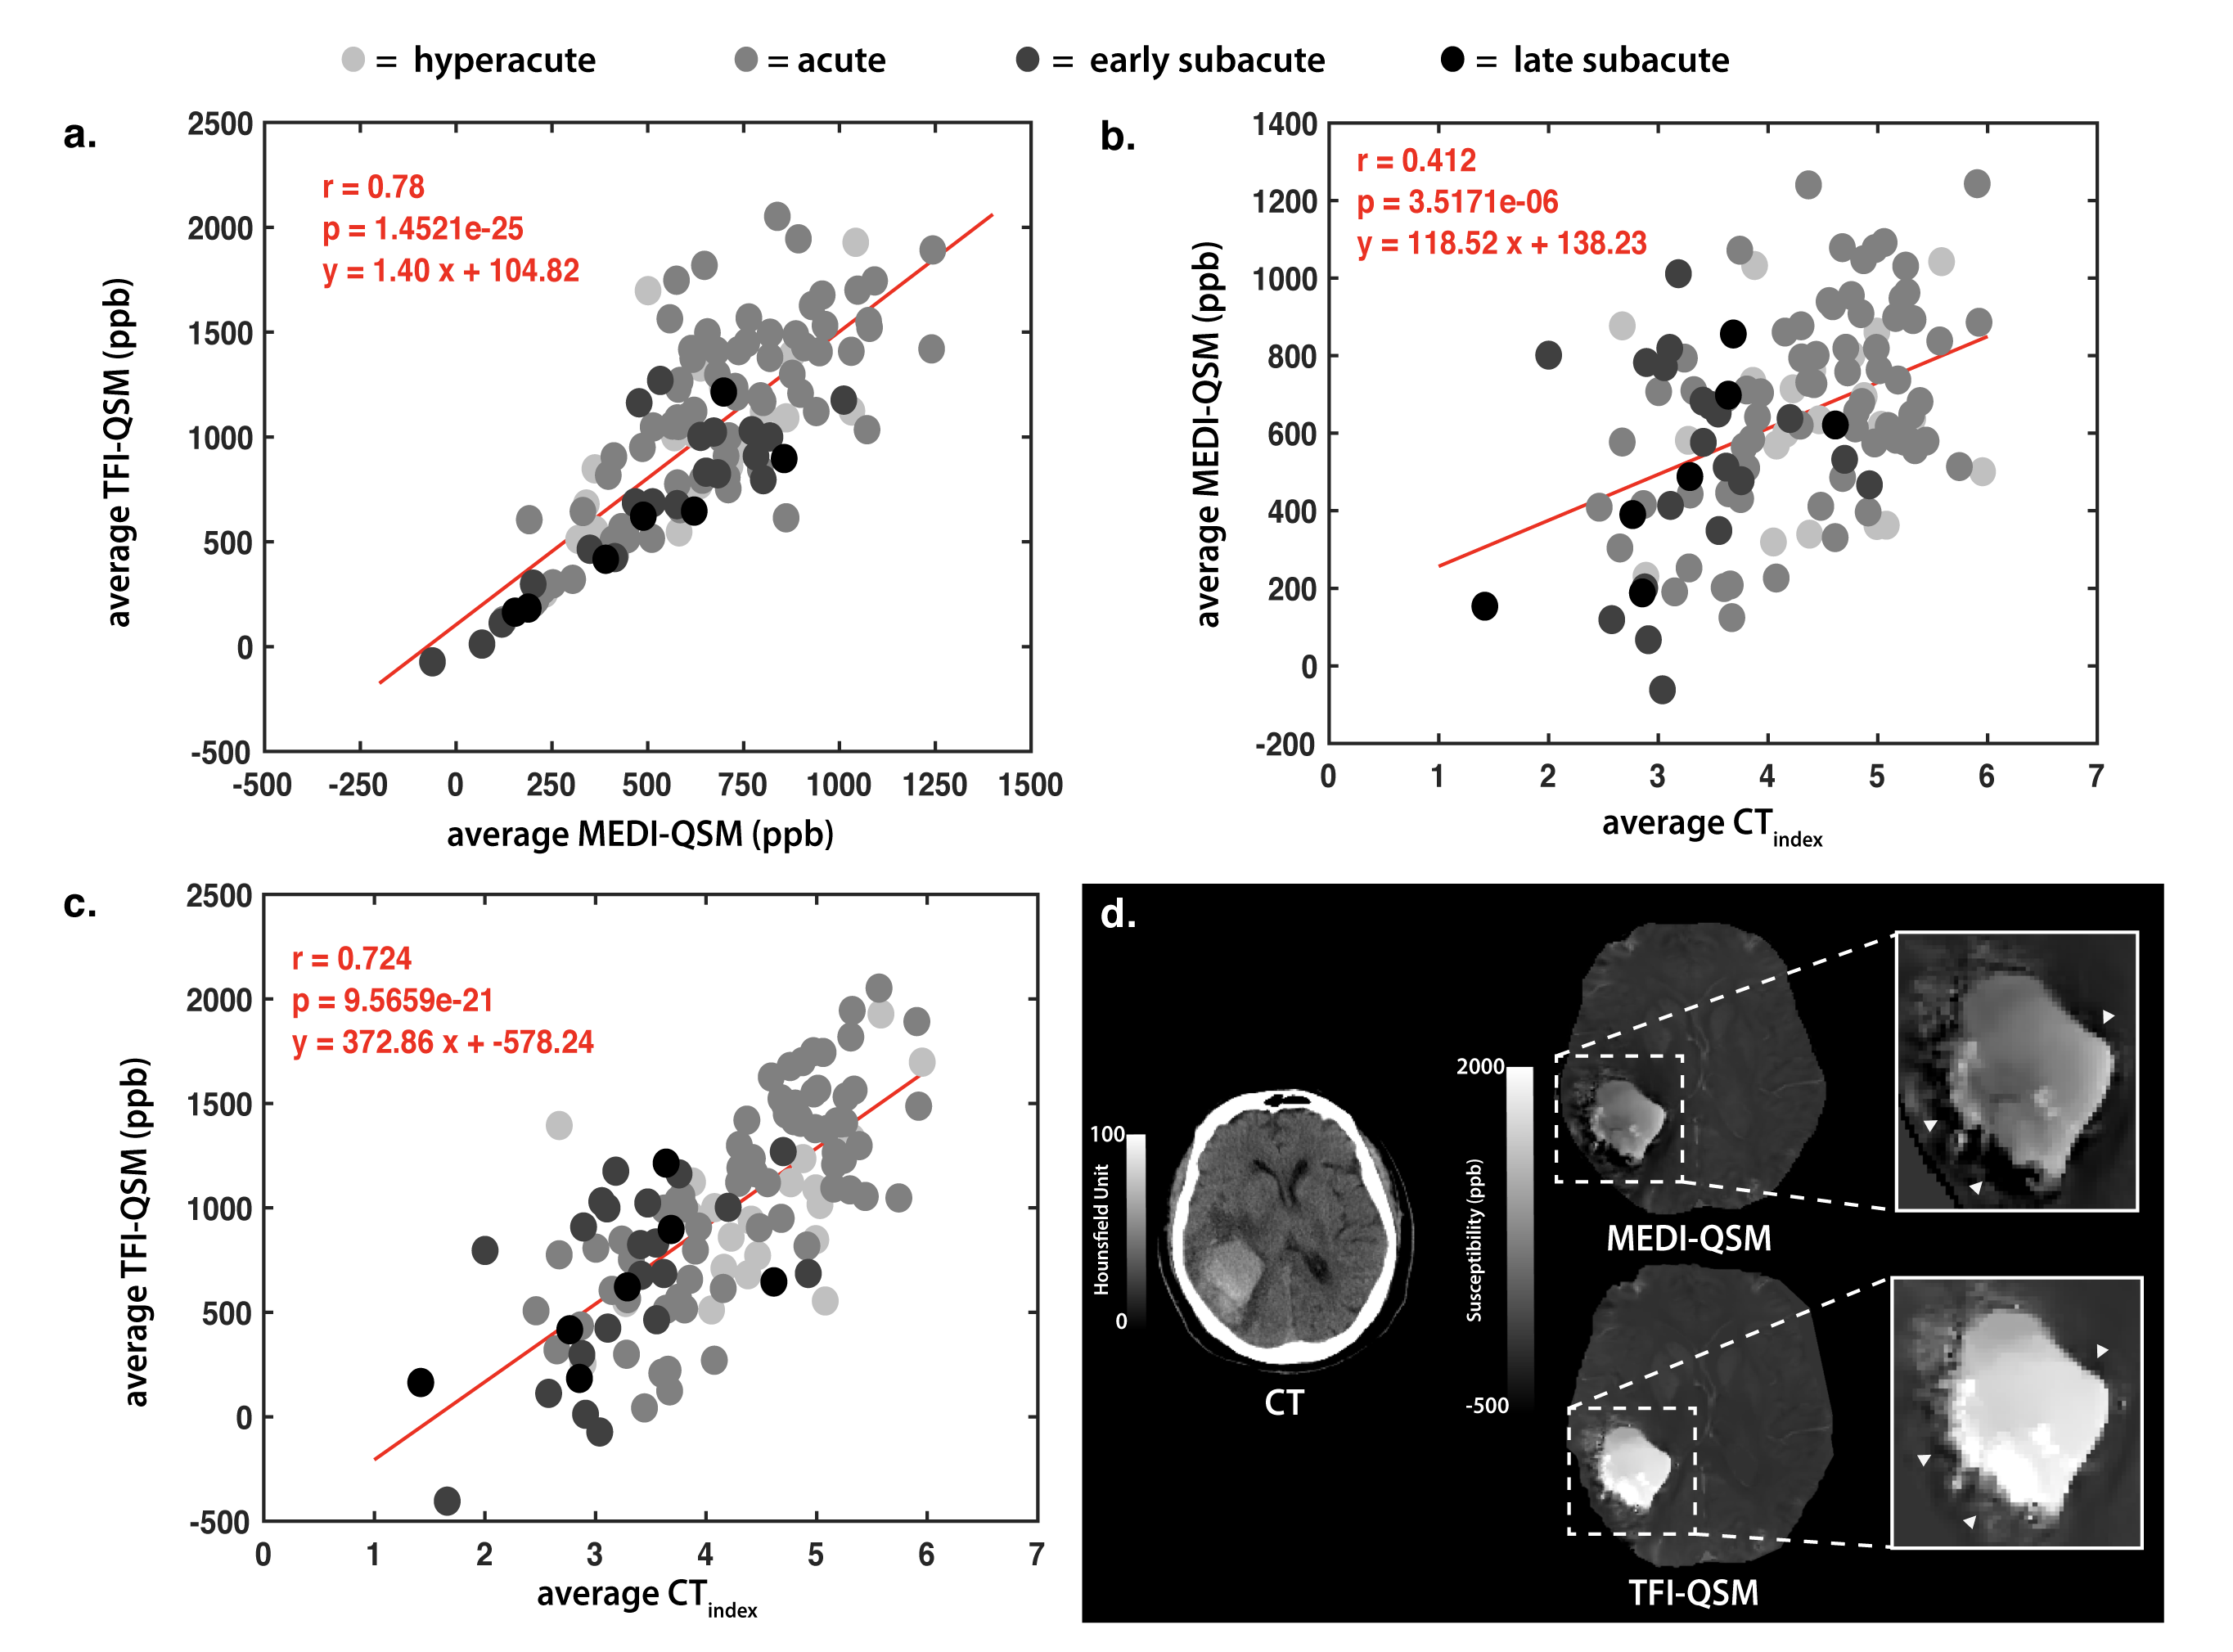
Figure 4. Comparison of MEDI and TFI measurements within the hemorrhagic lesion
Linear regressions between the Total Field Inversion (TFI) Quantitative Susceptibility Mapping (QSM) against the Morphological Enabled Dipole Inversion (MEDI) reconstruction (a), the MEDI-QSM against the CTindex (b), and the TFI-QSM against the CTindex (c) within the lesion. In (d), the shadowing artifact is shown around the hemorrhaged region using the MEDI reconstruction (top) , which is improved in TFI (bottom).