Yang Zhang1,2, Weikang Li3, Zhao Zhang3, Yingnan Xue3, Yan-Lin Liu2, Peter Chang2, Daniel Chow2, Ke Nie1, Min-Ying Su2, and Qiong Ye3,4
1Department of Radiation Oncology, Rutgers-Cancer Institute of New Jersey, Robert Wood Johnson Medical School, New Brunswick, NJ, United States, 2Department of Radiological Sciences, University of California, Irvine, CA, United States, 3Department of Radiology, The First Affiliate Hospital of Wenzhou Medical University, Wenzhou, China, 4High Magnetic Field Laboratory, Hefei Institutes of Physical Science, Chinese Academy of Sciences, Hefei, China
1Department of Radiation Oncology, Rutgers-Cancer Institute of New Jersey, Robert Wood Johnson Medical School, New Brunswick, NJ, United States, 2Department of Radiological Sciences, University of California, Irvine, CA, United States, 3Department of Radiology, The First Affiliate Hospital of Wenzhou Medical University, Wenzhou, China, 4High Magnetic Field Laboratory, Hefei Institutes of Physical Science, Chinese Academy of Sciences, Hefei, China
deep learning, with appropriate consideration of the peritumoral information, can be implemented to analyze the DCE-MRI to differentiate between PCa and BPH.
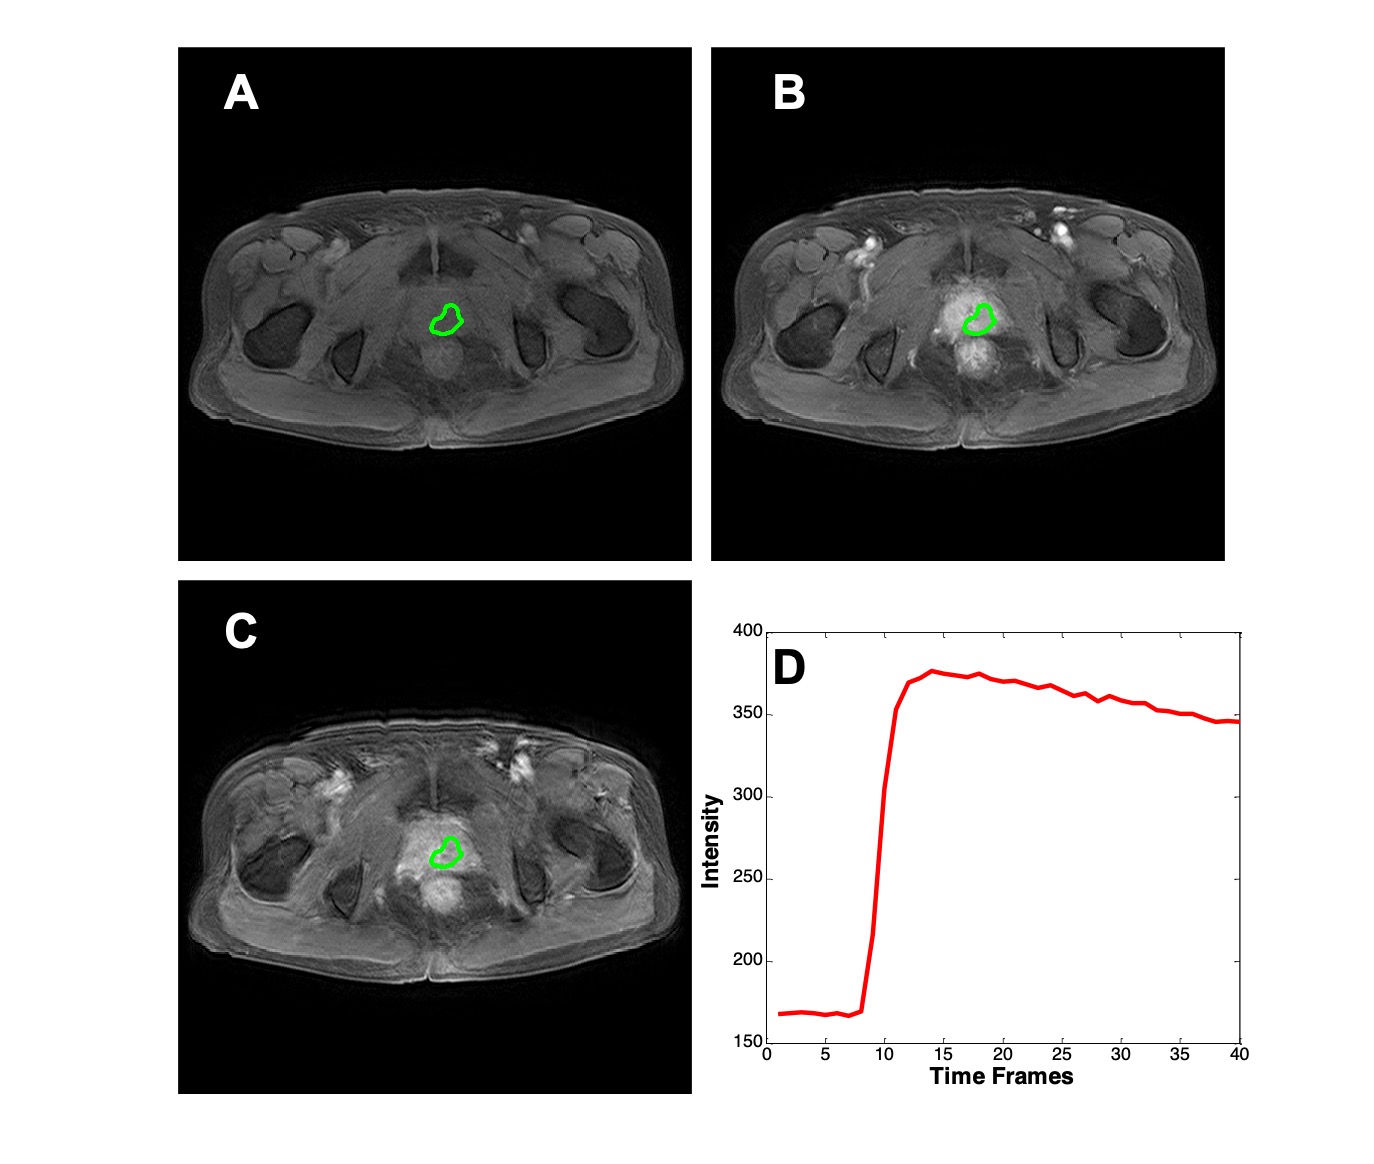
Figure 2: A
case example from an 83-year-old
man with
prostate cancer (tPSA=7.13
ng/ml, Gleason Score=4+5). The lesion is manually outlined. (A) The first DCE
time frame (pre-contrast image); (B) The 15th DCE time frame (post-contrast
image); (C) The 40th DCE time frame (post-contrast image); (D) the DCE time
intensity curve shows the wash-out kinetic pattern.
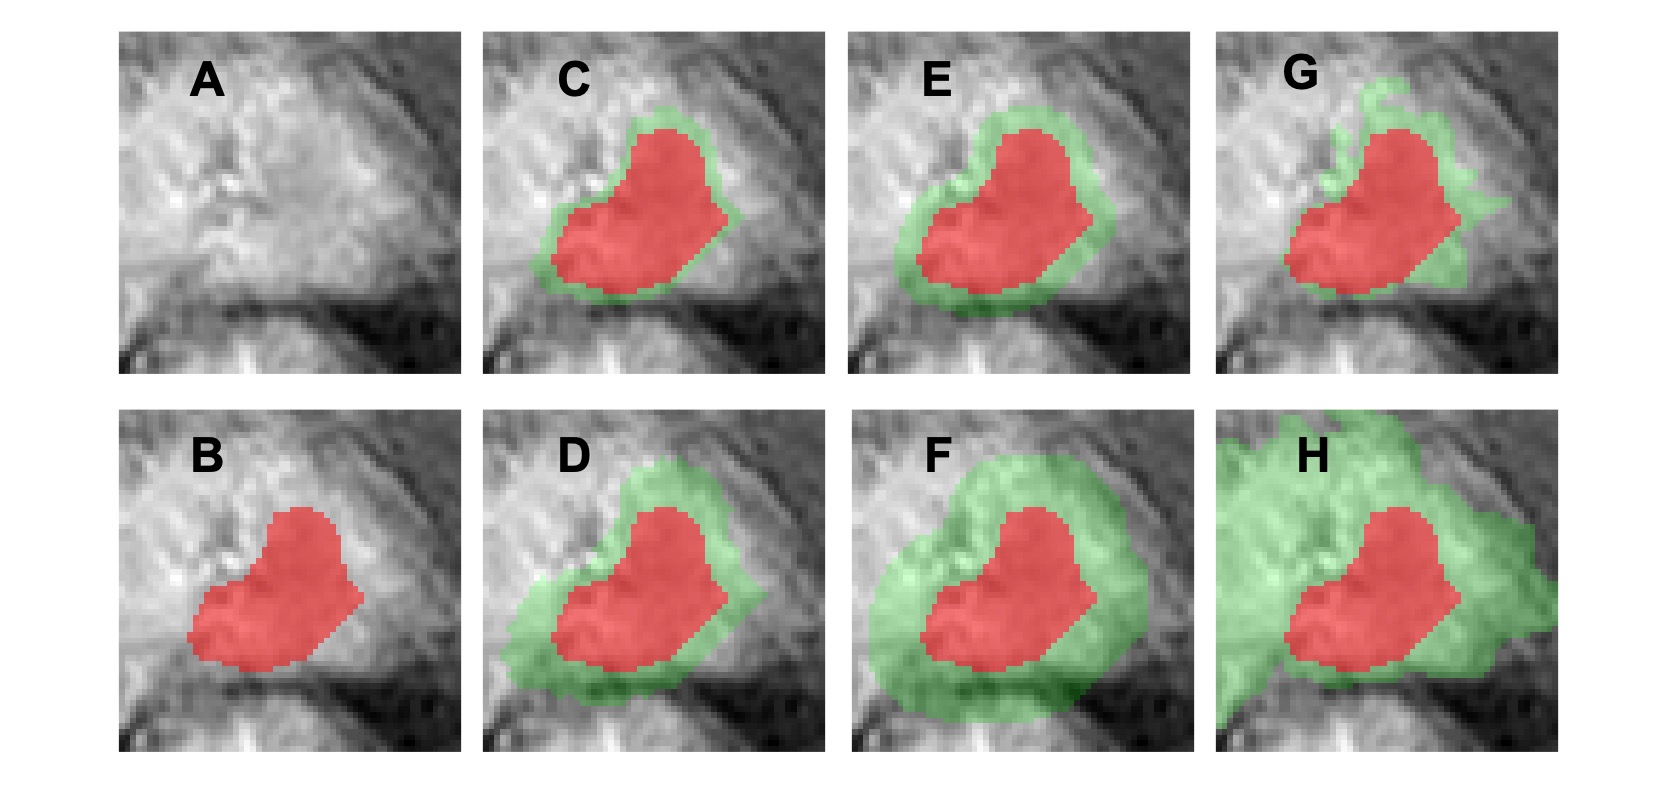
Figure
4: Different ROIs from the case shown on Figure 2, which
contains different amounts of peritumoral tissue as the input for the diagnostic neural network. (A) Original image, (B) Tumor alone (R0), (C)
120% enlarged tumor area
(R2),
(D) 150% enlarged tumor area
(R3), (E)
5-pixel expansion from the tumor boundary (R4), (F) 10-pixel expansion from the tumor
boundary (R5), (G)
region growing with ±20%
average intensity as the
stopping criteria (R7),
(F) region growing with ±30%
average intensity as the
stopping criteria (R8).