1School of Medicine, Department of Neuroradiology, Technical University of Munich, Munich, Germany, 2Department of Neurology, Goethe University Frankfurt, Frankfurt, Germany, 3School of Medicine, Clinic of Neurology, Technical University of Munich, Munich, Germany, 4Philips Healthcare, Hamburg, Germany, 5MRRC, Yale University, New Haven, CT, United States
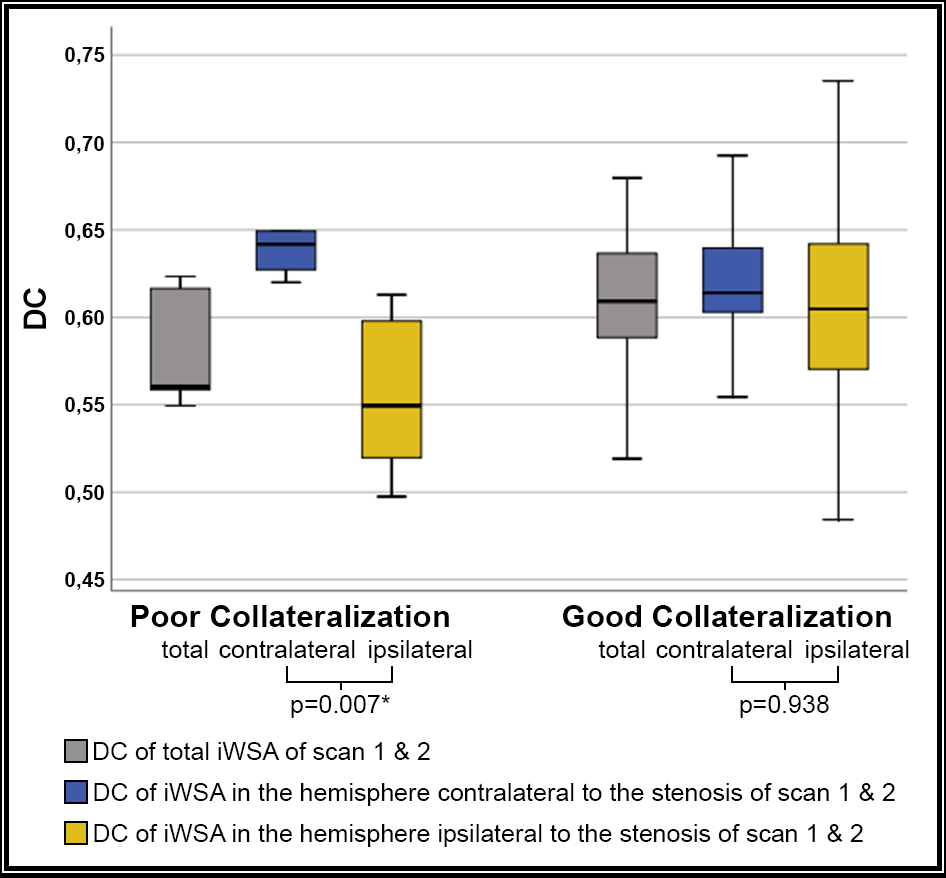
Figure 3. Box plots of DC indicate stronger spatial shifts of iWSAs in patients with poor Circle of Willis configuration.
The boxes contain all single-subject DC values between the first and third quartiles, the line inside marks the median, and the whiskers reach from minimum to maximum (not including outliers). In patients with poor Circle of Willis configuration (left), iWSA overlap between scan 1 and 2 differed more between hemispheres (p=0.007) while patients with sound configuration of the CoW did not present significant side differences (p=0.938).
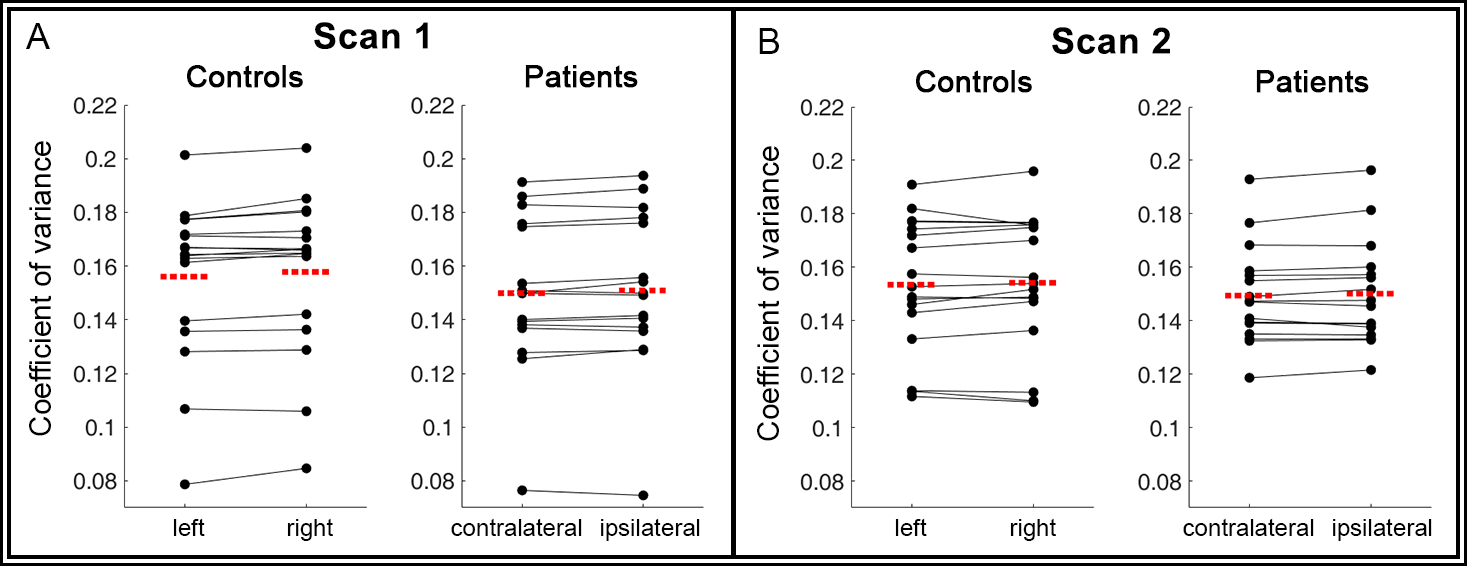
Figure 4. Paired Scatter Plots comparing single-subject coefficients of variance within the high CoV mask.
Data points represent mean coefficients of variance (CoV) of each subject for each hemisphere, lines connect the mean CoV between hemispheres. The red dashed line displays the group average. Stable CoV was found between hemispheres for both groups and scans. A two-sided t-test revealed no significant differences between hemispheres (controls in scan 1/2: p=0.86/0.94; patients in scan 1/2: p=0.92/0.92).