1Radiology & Nuclear Medicine, Erasmus University Medical Center, Rotterdam, Netherlands, 2Orthopaedics, Erasmus Univerity Medical Center, Rotterdam, Netherlands
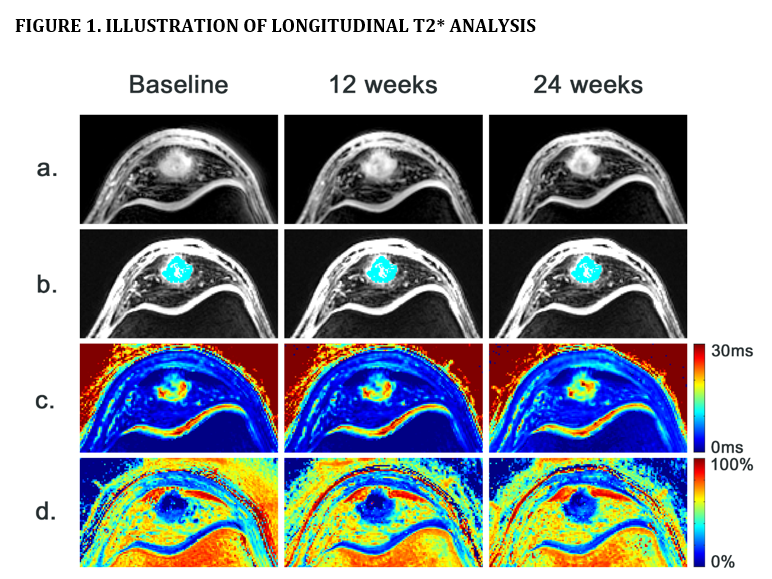
A) Axial 3D-UTE images of the proximal patellar tendon in a patient with patellar tendinopathy.
B) Selected voxels for tissue-specific T2* analysis in the degenerative tissue of the patellar tendon. Mean T2* decreased from 19.9±7.3 ms (baseline) to 17.2±5.8 ms (12 weeks) to 16.8±4.9 ms (24 weeks).
C) Mono-exponential T2* maps, on a scale from dark blue (short T2* relaxation times) to red (long T2* relaxation times).
D) Bi-exponential fitting maps, displaying the percentage of short T2* components on a scale from dark blue (0% short T2* components) to red (100% short T2* components).
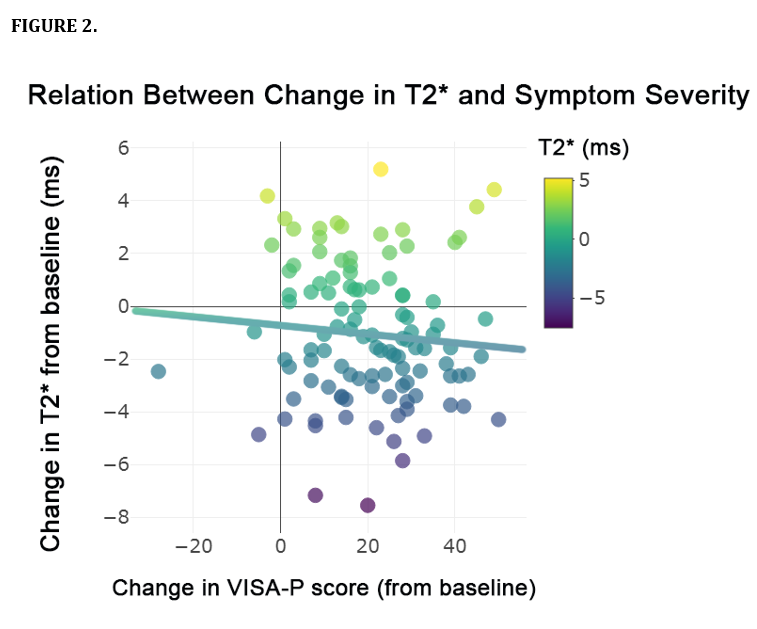
Relation between the change in T2* relaxation times and symptom severity. Symptom severity was assessed using the validated VISA-P questionnaire (scale 0-100), where 100 represents no pain, unrestricted function and maximum ability to play sports.