1Centre for Biomedical Engineering, Indian Institute of Technology Delhi, New Delhi, India, 2Radio diagnosis, All India Institute of Medical Sciences Delhi, New Delhi, India, 3Department of Medical Oncology, Dr. B.R. Ambedkar Institute-Rotary Cancer Hospital (IRCH), All India Institute of Medical Sciences Delhi, New Delhi, India, 4Department of Biomedical Engineering, All India Institute of Medical Sciences Delhi, New Delhi, India
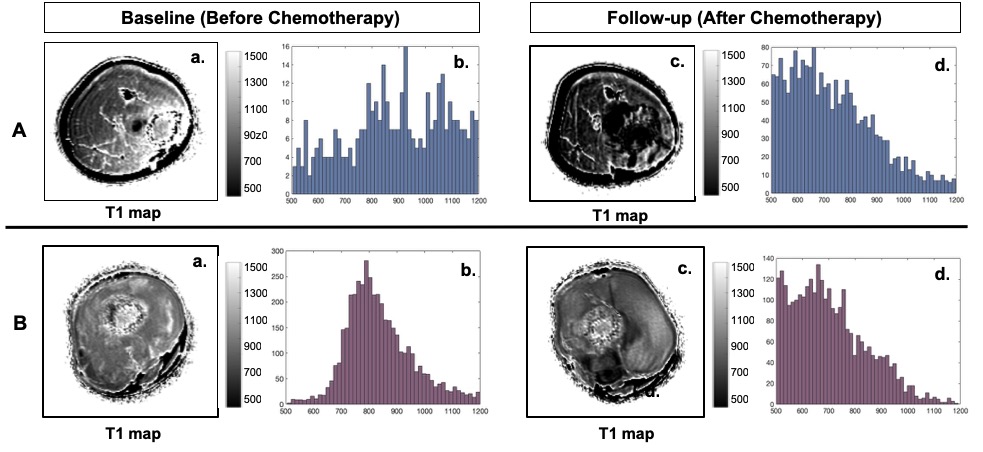
Figure 2: Images are from A. a representative patients (M, 15 years) from Response group with osteosarcoma in right Tibia. B. a representative patients (M, 14 years) from Non-Response group with osteosarcoma in right femur.
For A and B: a, c) Estimated T1 maps and b, d) Histogram of T1 values in tumor at baseline and follow-up respectively.
A comparatively higher reduction tumor T1 can be observed after chemotherapy for Responder than Non-responder. Histogram of tumor T1 for Responder was low picked at baseline and became more positively skewed after chemotherapy than Non-responder.
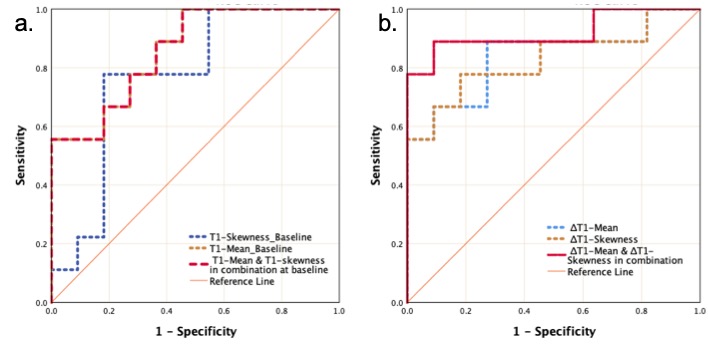
Figure 3: ROC curve analysis using statistically significant (p<0.5) histogram parameters of T1 value in tumor a) at baseline and b) its relative percentage changes (Δ) at follow-up.
a) At baseline T1-mean and T1-skewness in combination produced AUC=0.86, sensitivity=88%, specificity=72% in identifying chemotherapeutic response.
b) After chemotherapy, ΔT1-mean and ΔT1-skewness in combination produced AUC=0.92, sensitivity=89%, specificity=92% in identifying chemotherapeutic response.