Lieke van den Wildenberg1, Arjan Hendriks1, Wybe van der Kemp1, Dennis Klomp1, and Jeanine Prompers1
1Radiology Department, UMC Utrecht, Utrecht, Netherlands
1Radiology Department, UMC Utrecht, Utrecht, Netherlands
With
the application of a spectral-spatial RF pulse, we were able to map total
choline using a 3D 1H-MRSI
sequence
with full liver coverage at maximum intrinsic sensitivity
(short TE and TR).
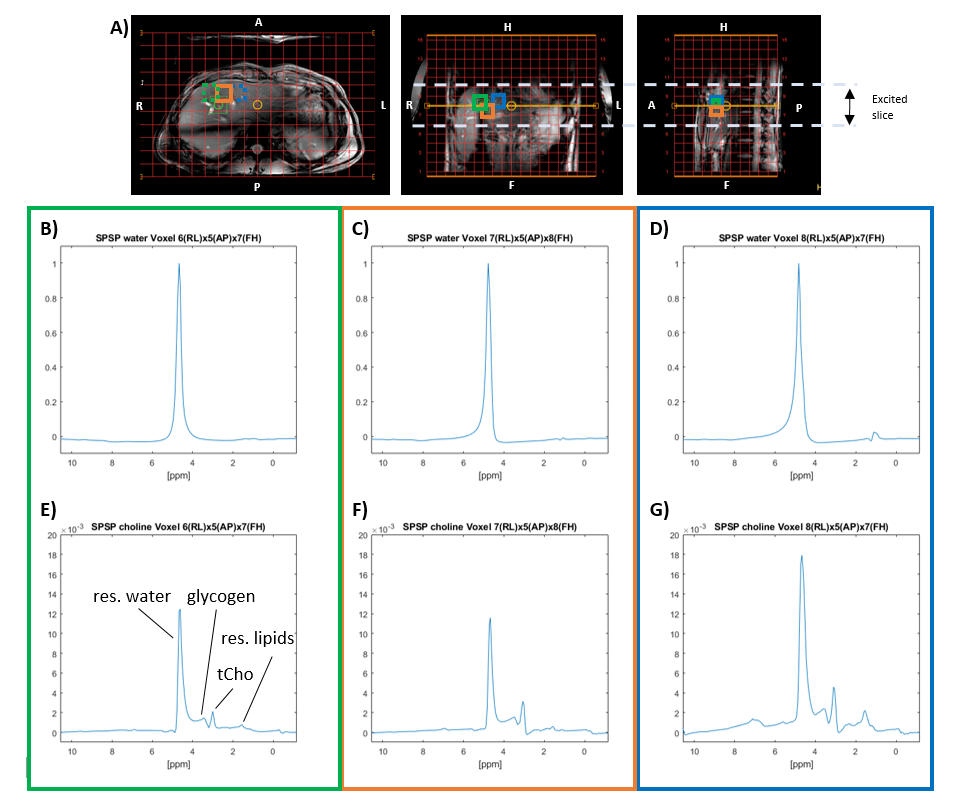
Figure
5: In-vivo 3D 1H-MRSI SPSP liver data of one volunteer. A) Transverse,
coronal and sagittal MR image of the liver overlaid with the 1H-MRSI
grid. Spectra of three different voxels indicated in panel A are shown in the green (B-SPSP
water, E-SPSP choline), orange (C-SPSP water, F-SPSP choline) and blue (D-SPSP
water, G-SPSP choline) frames below.
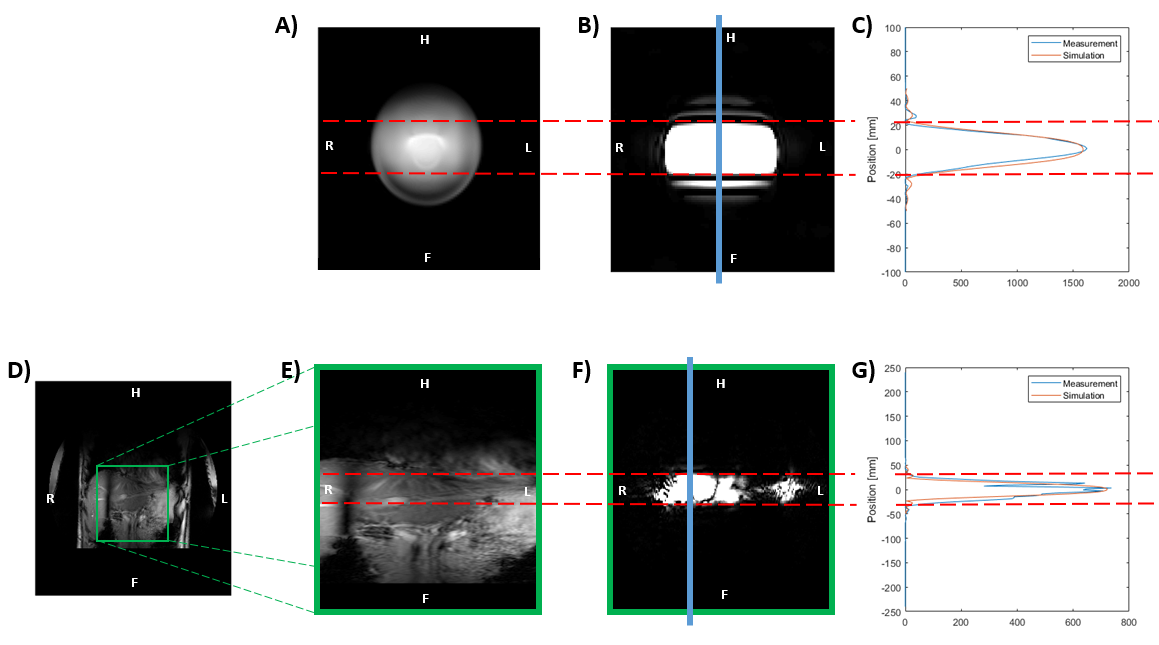
Figure
3: Coronal image of the
spherical phantom (d=10cm) (A) and
the liver (E) with a normal
excitation pulse, but without slice selection, and with the spectral-spatial
pulse (B and F), showing the transversal slice excited by the spectral-spatial
pulse. Panel D shows a normal
coronal image of the body with coronal slice selection as a reference. Line
profiles through the images acquired with the spectral-spatial pulse (blue
lines in B and F) in the phantom (C) and
in the liver (G).