Stefan Markovic1, Tangi Roussel2, Keren Sasson3, Dina Preise3, Lilach Agemi3, Avigdor Scherz3, and Lucio Frydman1
1Department of Chemical and Biological Physics, Weizmann Institute of Science, Rehovot, Israel, 2Center for Magnetic Resonance in Biology and Medicine, Marseille, France, 3The Moross Integrated Cancer Research Center, Weizmann Institute of Science, Rehovot, Israel
1Department of Chemical and Biological Physics, Weizmann Institute of Science, Rehovot, Israel, 2Center for Magnetic Resonance in Biology and Medicine, Marseille, France, 3The Moross Integrated Cancer Research Center, Weizmann Institute of Science, Rehovot, Israel
Deuterium
Metabolic Imaging was used to follow the metabolic conversion of 2H6,6’-glucose
in a pancreatic cancer mouse model at 15.2T. Lactate was produced exclusively in
the tumors, leading to the marking of the latter within the abdomen.
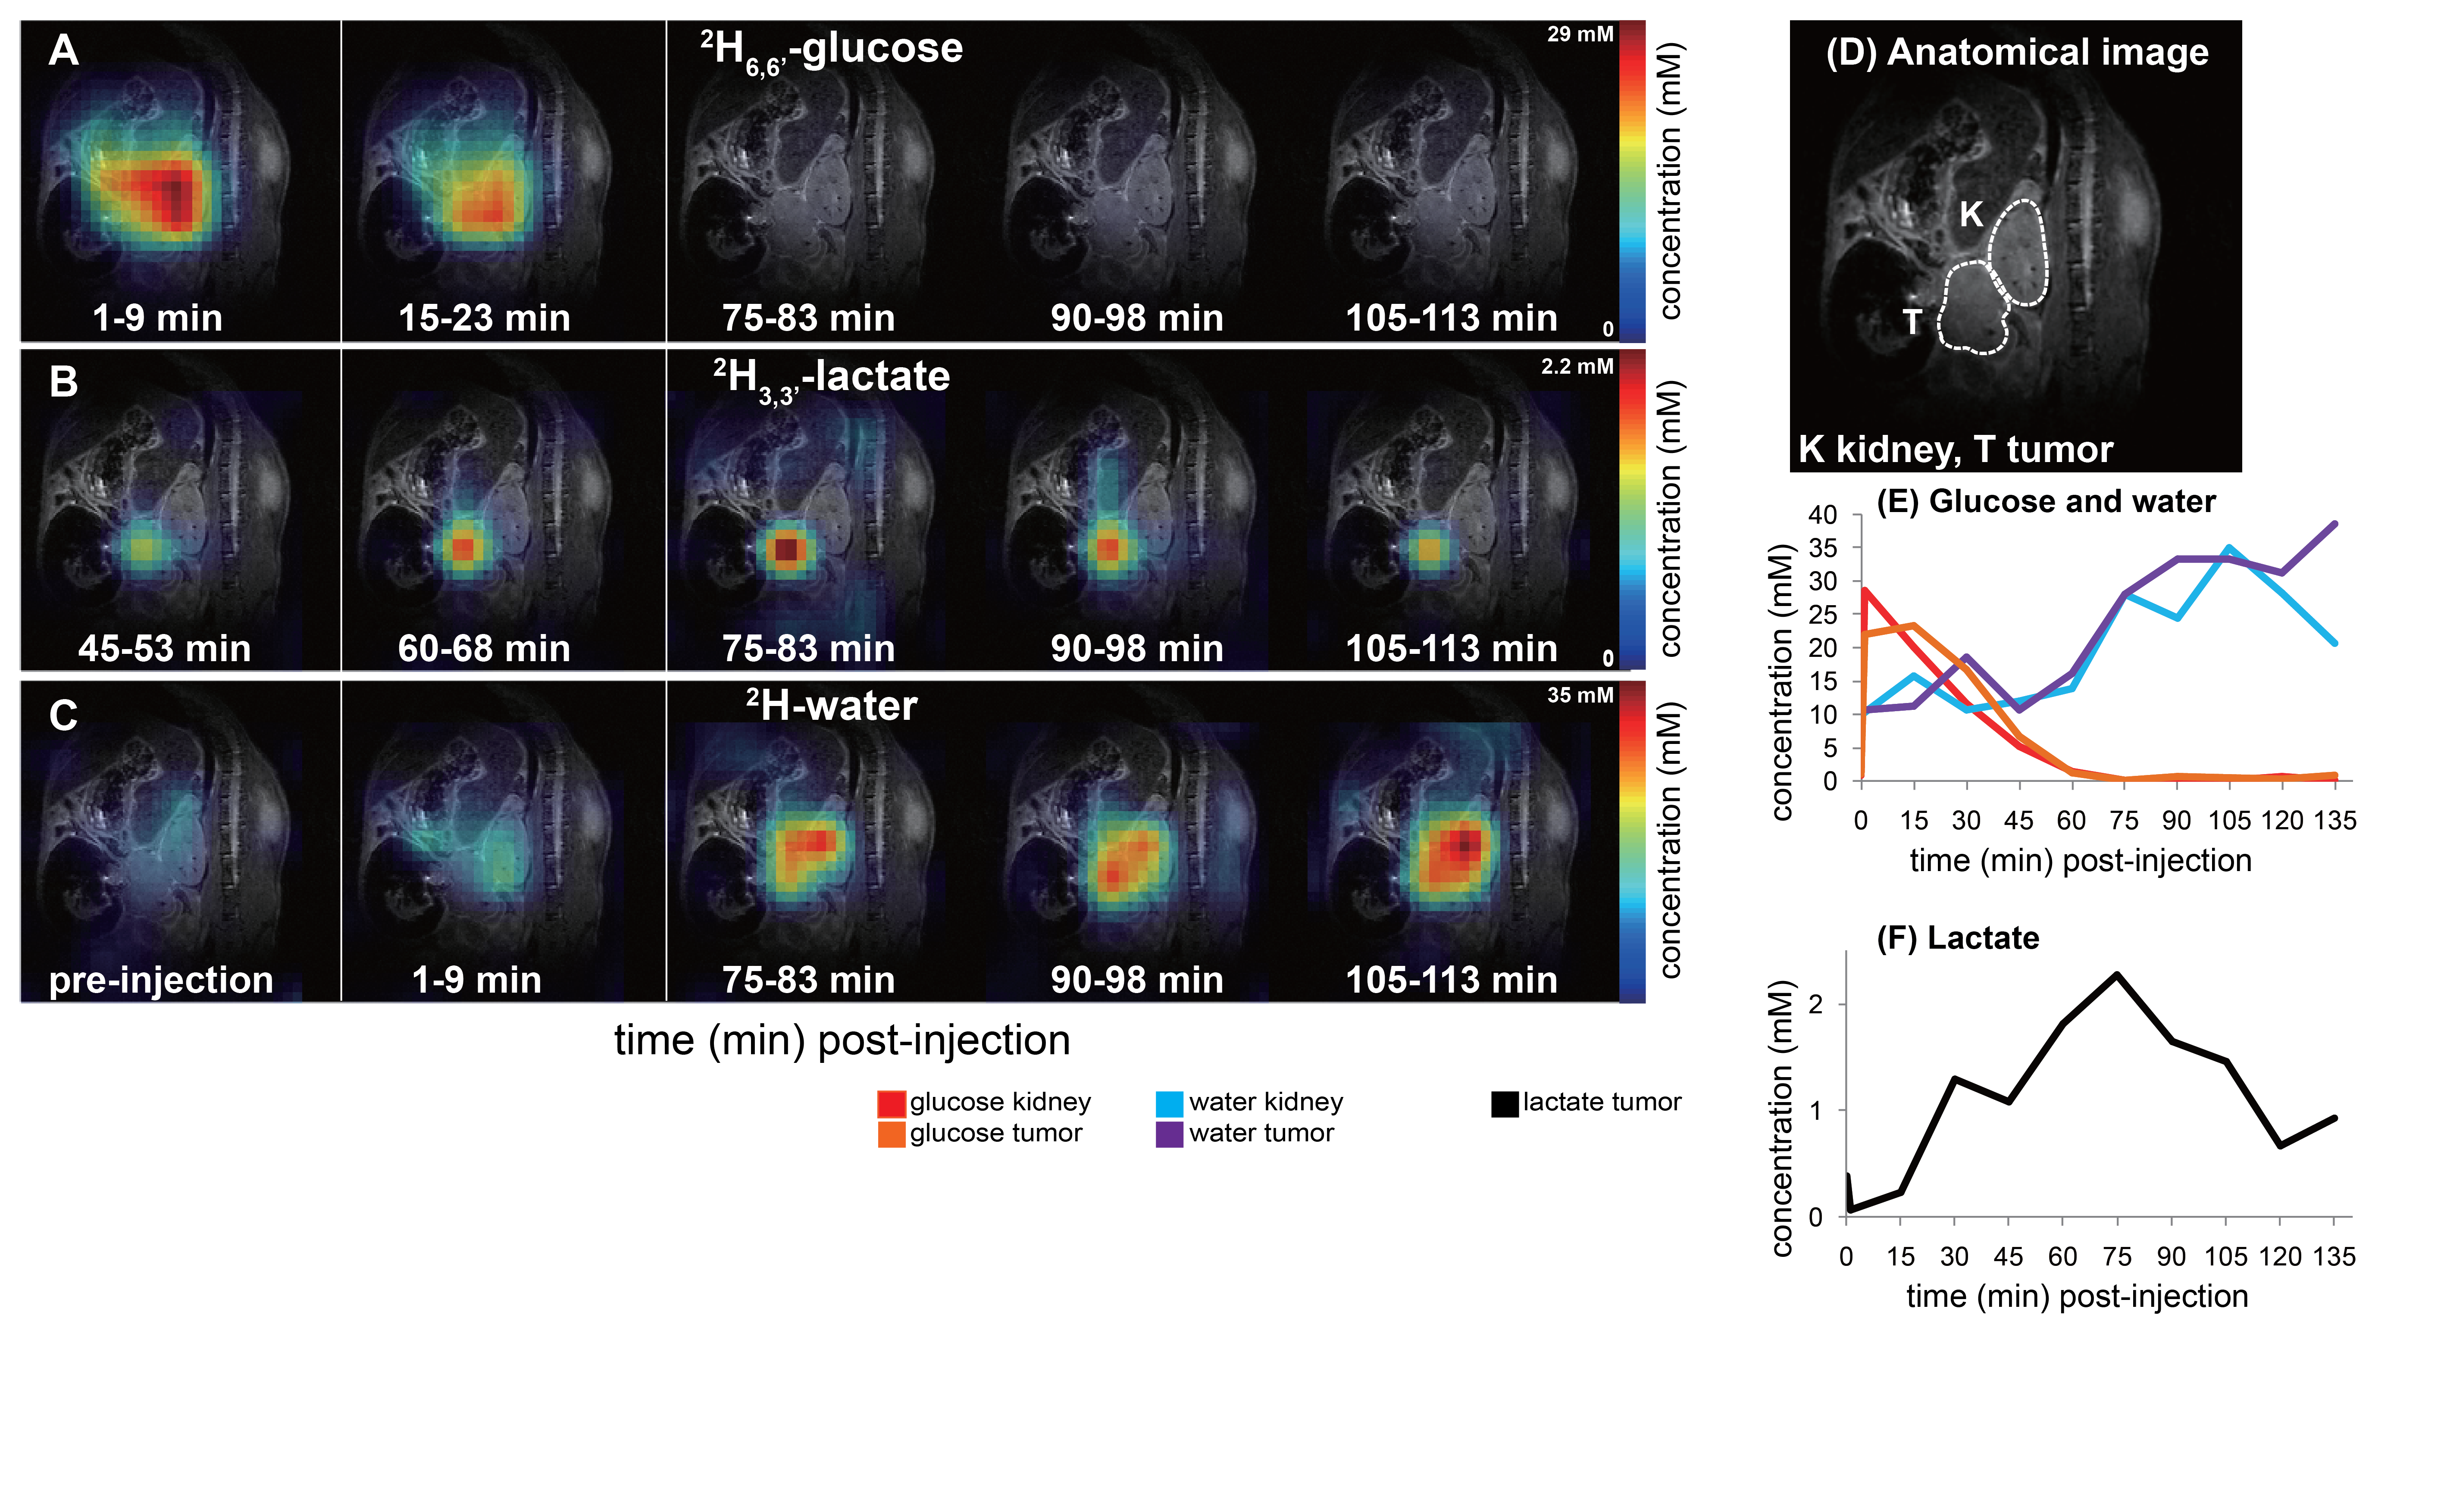
DMI
data collected at the indicated stages following the intravenous administration
of 2H6,6’-glucose to a pancreatic cancer mouse. Metabolic
maps of 2H6,6’-glucose (A) and its metabolic products 2H3,3’-lactate
(B) and 2H-water (C) are here shown as absolute concentration
colormaps. The anatomical 1H image on top of which all 2H
data are shown is depicted in (D). Concentrations for glucose and water (E) and
for the lactate (F) are shown for the entire time series.
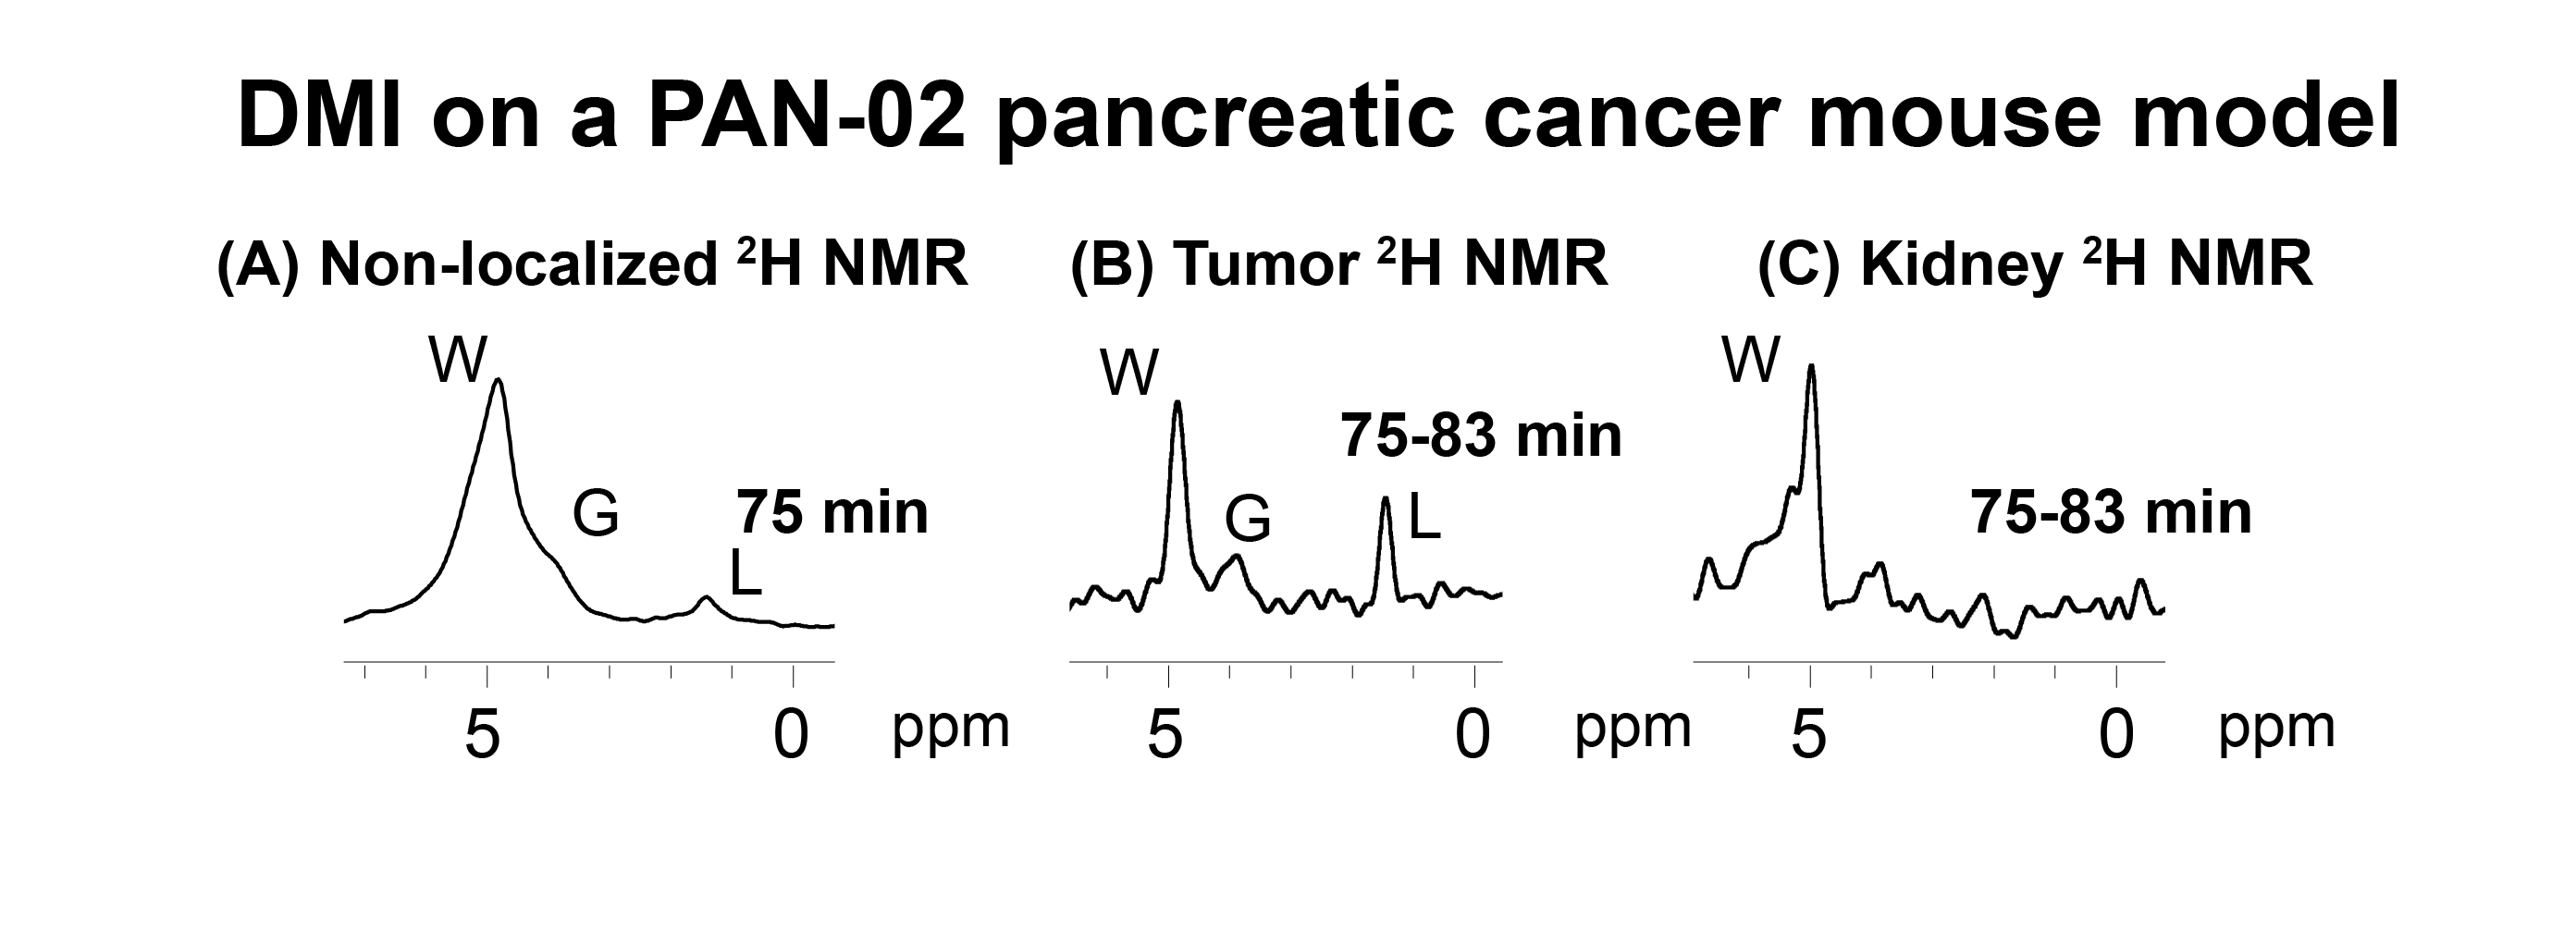
2H NMR spectra
arising at the indicated times after an intravenous 2H6,6’-glucose
administration into a pancreatic cancer mouse model. (B) and (C) show organ-specific
2H spectra extracted from the CSI data at the indicated sites. Signals
for 2H6,6’-glucose and its metabolic products water and
lactate are indicated by letters G, W and L respectively.