Andreas Korzowski1, Nina Weckesser2, Vanessa L Franke1, Heinz-Peter Schlemmer2, Mark E Ladd1, Peter Bachert1, and Daniel Paech2
1Medical Physics in Radiology, German Cancer Research Center (DKFZ), Heidelberg, Germany, 2Radiology, German Cancer Research Center (DKFZ), Heidelberg, Germany
1Medical Physics in Radiology, German Cancer Research Center (DKFZ), Heidelberg, Germany, 2Radiology, German Cancer Research Center (DKFZ), Heidelberg, Germany
The presented high-quality 31P
brain spectra from individual tissue types obtained at B0 = 7T illustrate clear differences not only between
healthy and tumor tissues, but also between different compartments within diseased
tissue.
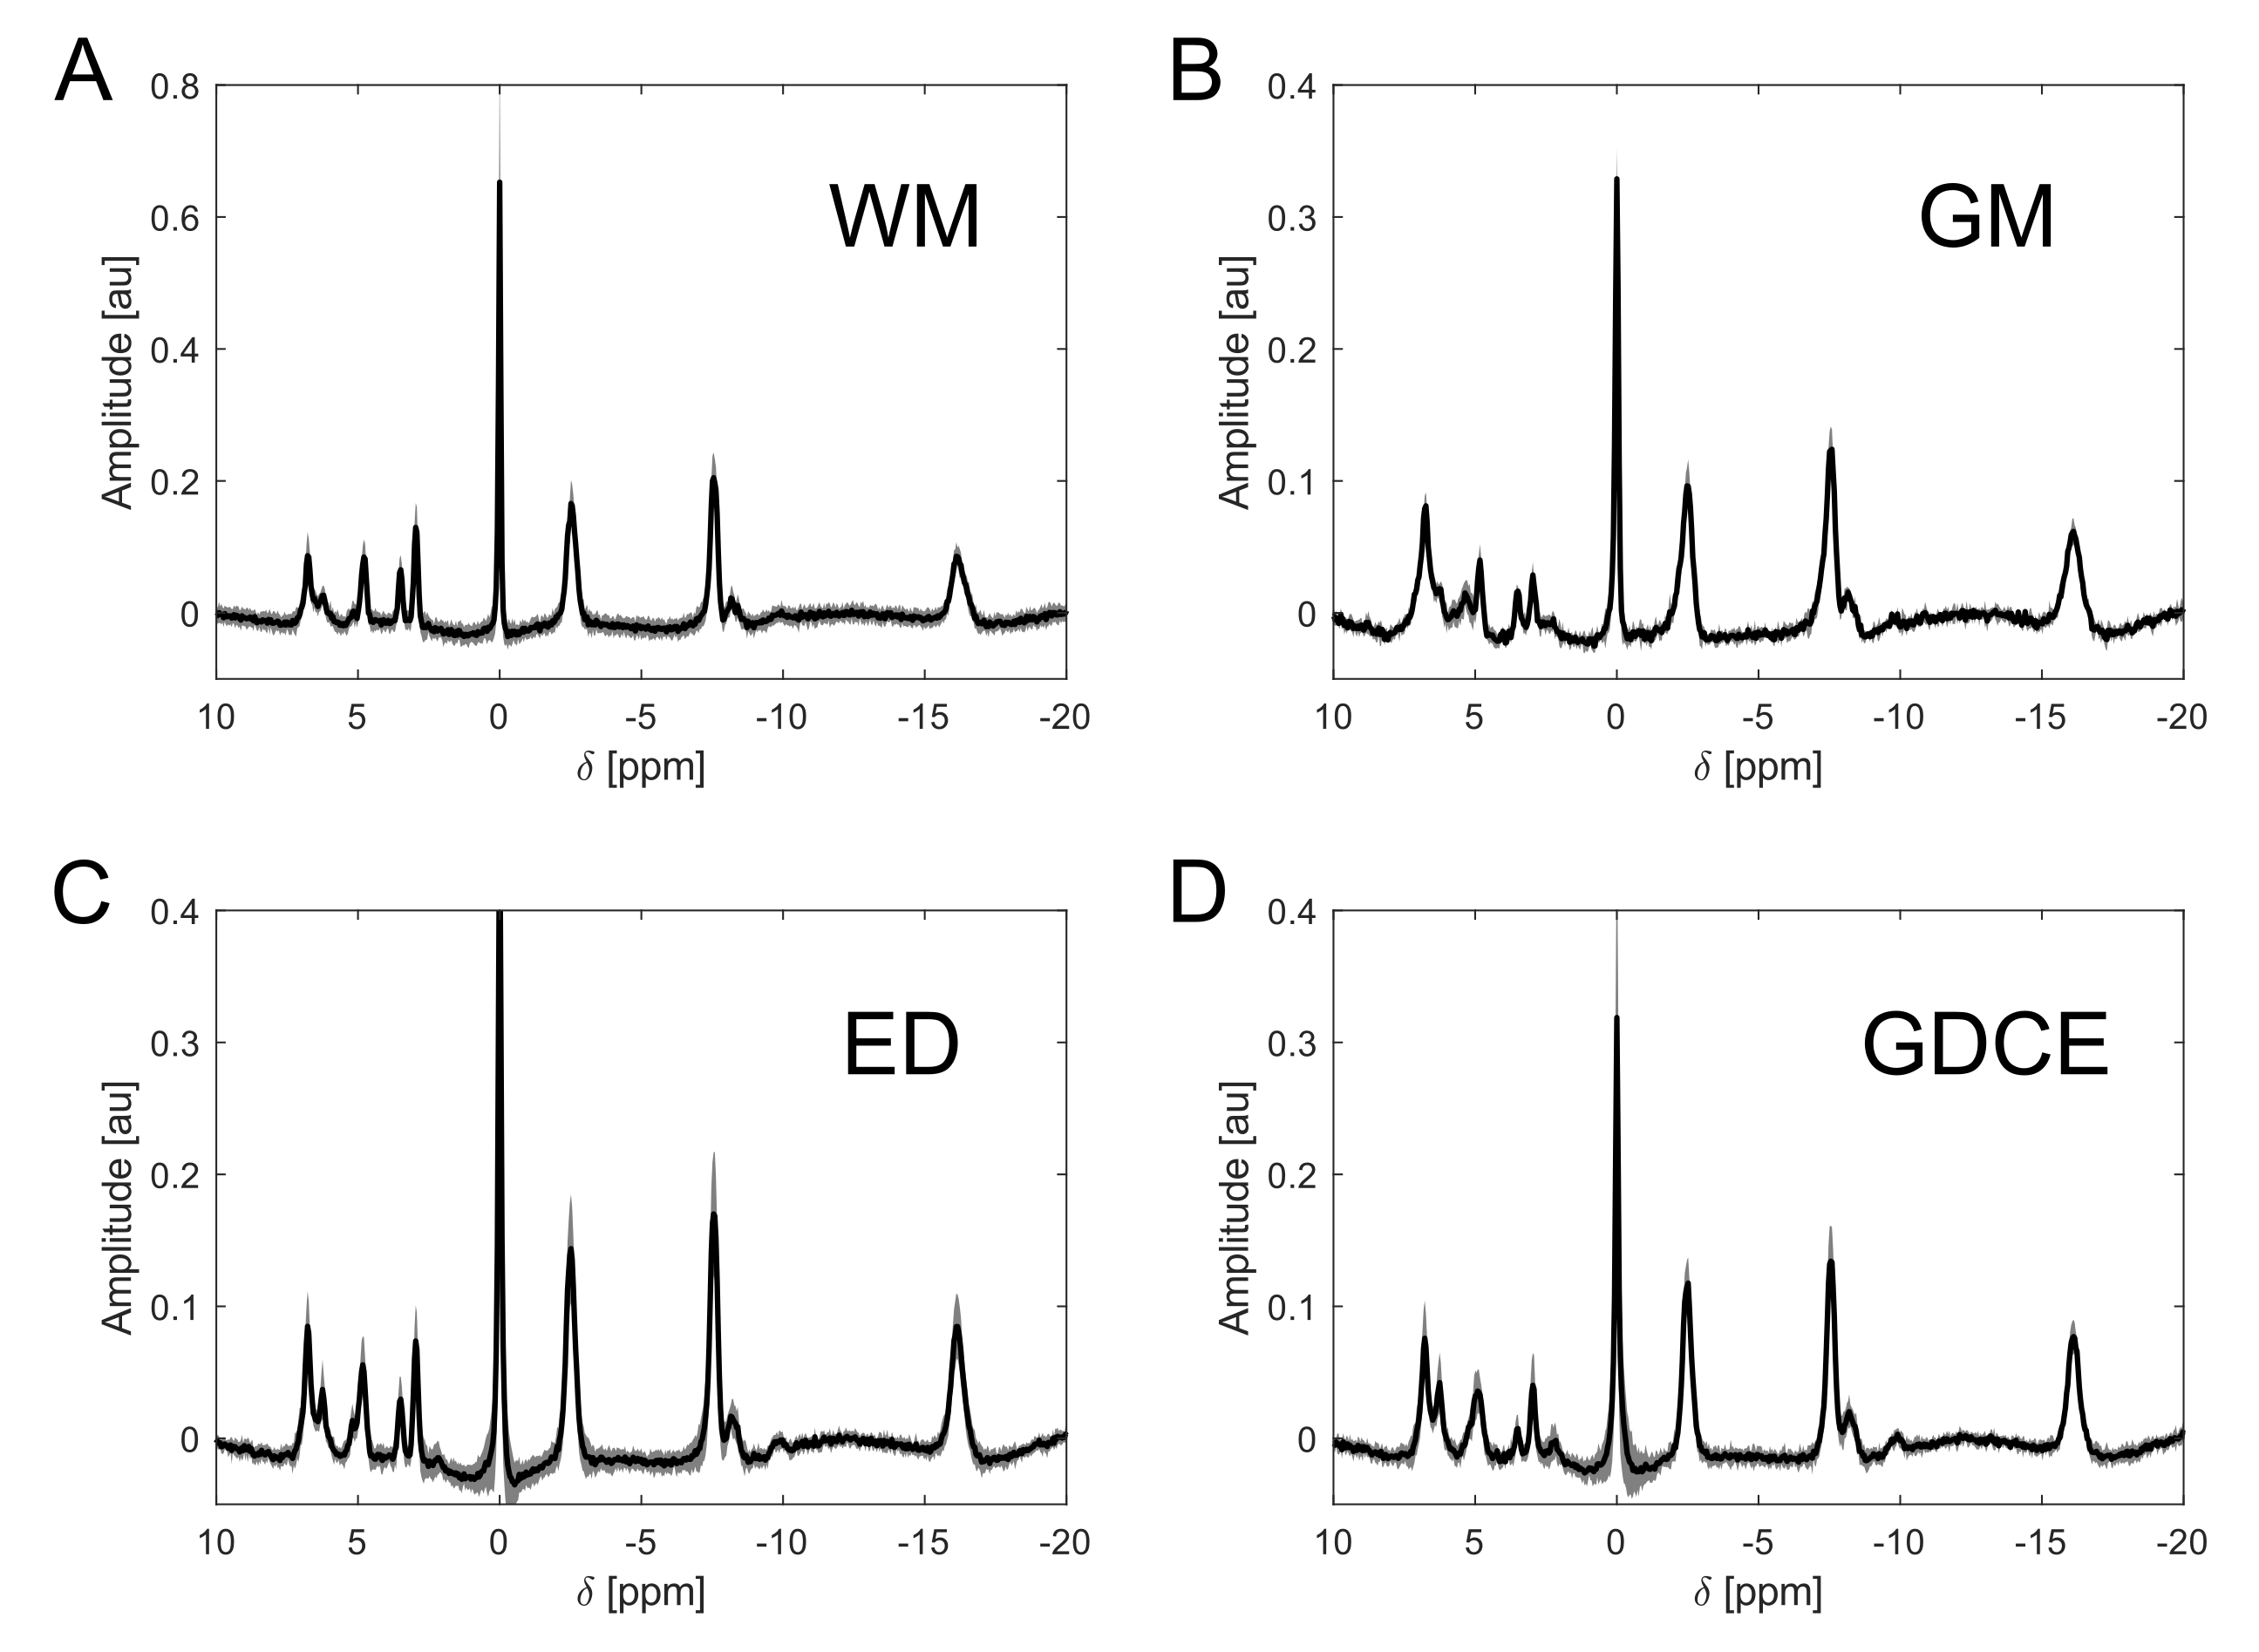
Subject-averaged 31P
spectra (black lines) of individual brain tissue types, with corresponding
standard deviation across subjects (gray shading). For white matter (A), 15
ROIs were averaged (6 from volunteers, 9 from patients), and 3 ROIs for gray
matter (B). For edema (C), 9 ROIs were averaged (from all patients), and 7 ROIs
for Gd-contrast enhancement (D, from all high-grade glioma patients).
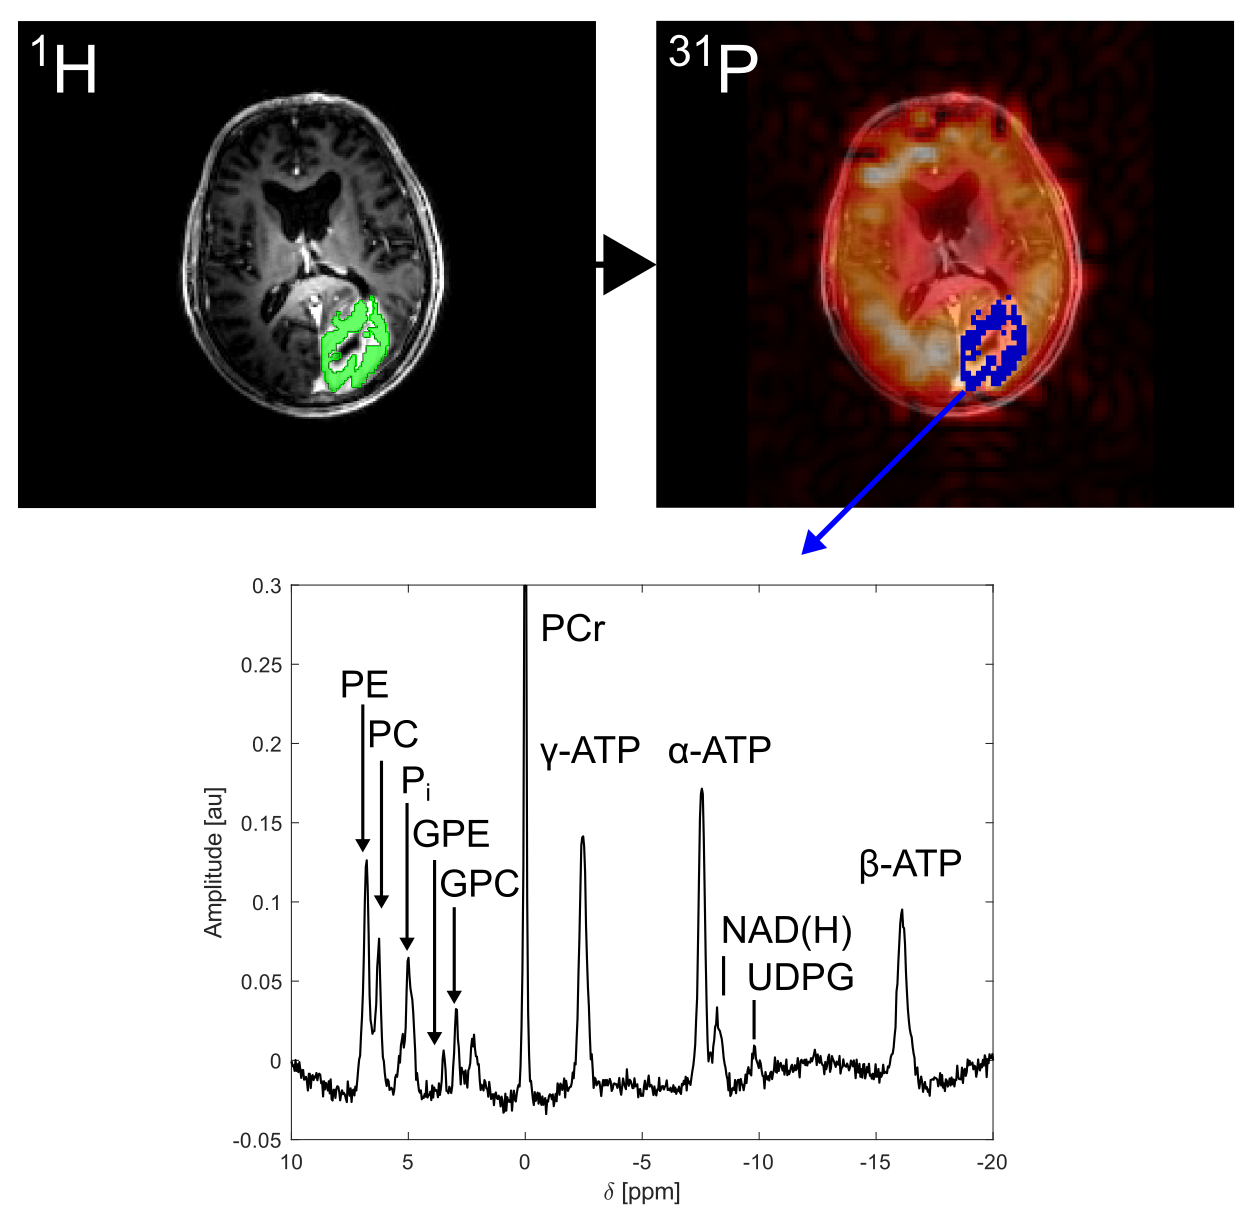
Example data processing for a
GDCE ROI in a high-grade glioma patient. The high-resolution ROI (green) drawn
on 1H images is mapped onto the interpolated 31P MRSI
grid (matrix = 80×96×64, 31P intensity map is shown). Within the
resulting low-resolution ROI (blue), phase-/frequency-aligned spectra are summed
up to yield the ROI-averaged spectrum.
PCr, phosphocreatine; ATP,
adenosine-5’-triphosphate; NAD(H), nicotinamide dinucleotide, UDPG, uridine
disphosphoglucose; (G)PE, (glycero)phosphoethanolamine; (G)PC,
(glycero)phosphocholine; Pi, inorganic phosphate.