Cornelius Cadrien1,2, Sukrit Sharma1, Philipp Lazen1, Julia Furtner3, Alexandra Lipka1,4, Eva Hečková1, Lukas Hingerl1, Stanislav Motyka1, Stephan Gruber1, Bernhard Strasser1, Barbara Kiesel2, Mario Mischkulnig2, Matthias Preusser5, Thomas Roetzer6, Adelheid Wöhrer6, Michael Weber7, Christian Dorfer2, Karl Rössler2, Siegfried Trattnig1,4, Wolfgang Bogner1, Georg Widhalm2, and Gilbert Hangel1,2
1High-field MR Center, Department of Biomedical Imaging and Image-guided Therapy, Medical University of Vienna, Vienna, Austria, 2Department of Neurosurgery, Medical University of Vienna, Vienna, Austria, 3Division of Neuroradiology and Musculoskeletal Radiology, Department of Biomedical Imaging and Image-guided Therapy, Medical University of Vienna, Vienna, Austria, 4Christian Doppler Laboratory for Clinical Molecular MR Imaging, Vienna, Austria, 5Division of Oncology, Department of Inner Medicine I, Medical University of Vienna, Vienna, Austria, 6Division of Neuropathology and Neurochemistry, Department of Neurology, Medical University of Vienna, Vienna, Austria, 7Division of Medical Imaging and Nuclear Medicine, Medical University of Vienna, Vienna, Austria
1High-field MR Center, Department of Biomedical Imaging and Image-guided Therapy, Medical University of Vienna, Vienna, Austria, 2Department of Neurosurgery, Medical University of Vienna, Vienna, Austria, 3Division of Neuroradiology and Musculoskeletal Radiology, Department of Biomedical Imaging and Image-guided Therapy, Medical University of Vienna, Vienna, Austria, 4Christian Doppler Laboratory for Clinical Molecular MR Imaging, Vienna, Austria, 5Division of Oncology, Department of Inner Medicine I, Medical University of Vienna, Vienna, Austria, 6Division of Neuropathology and Neurochemistry, Department of Neurology, Medical University of Vienna, Vienna, Austria, 7Division of Medical Imaging and Nuclear Medicine, Medical University of Vienna, Vienna, Austria
We investigated 7T MRSI- based metabolite ratio maps of 36 WHO grade 2-4 glioma patients in defined ROIs. We found significant differences between tumor and NAWM ROIs as well as significantly less mIns/tCr in high- versus low-grades.
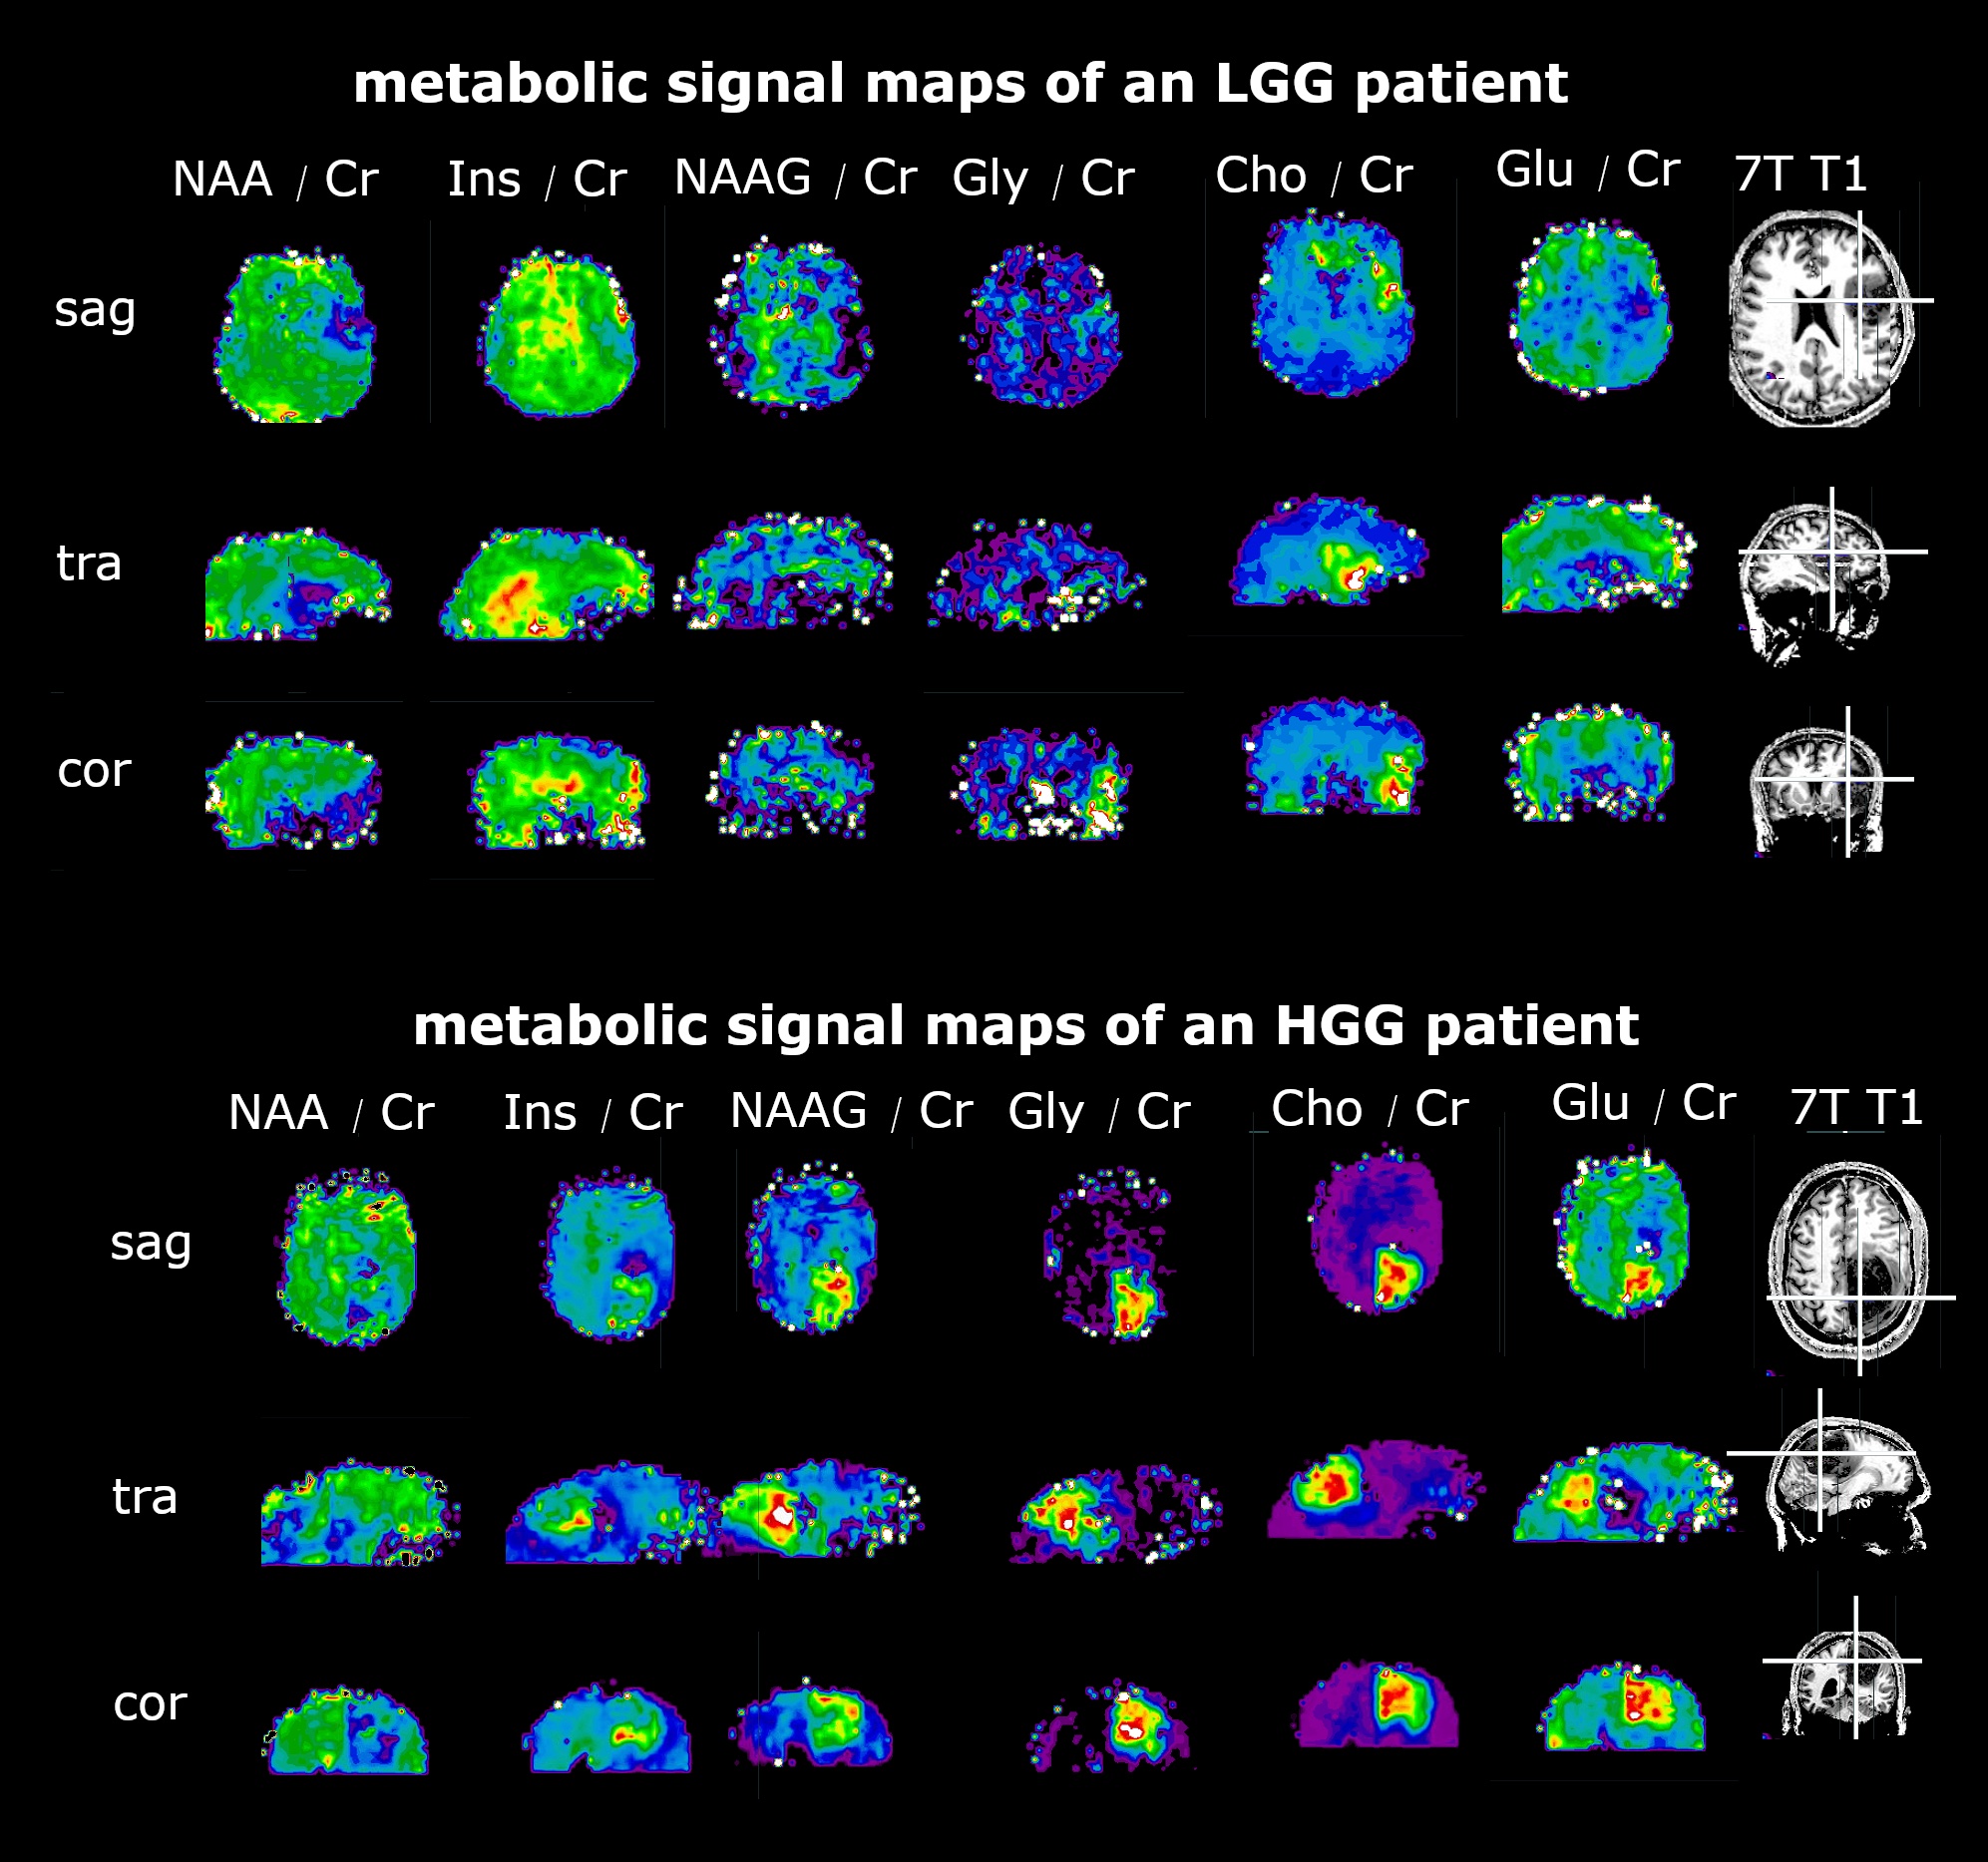
Fig 3 - Direct comparison figure - LGG vs HGG
We can see ratio maps of different metabolites to Creatine ratios and the 3T contrast-enhancing clinical images, as well as the 7T T1 images. The LGG patient on top shows a different metabolite pattern in the region of the contrast-enhancing region, compared to the HGG patient below.
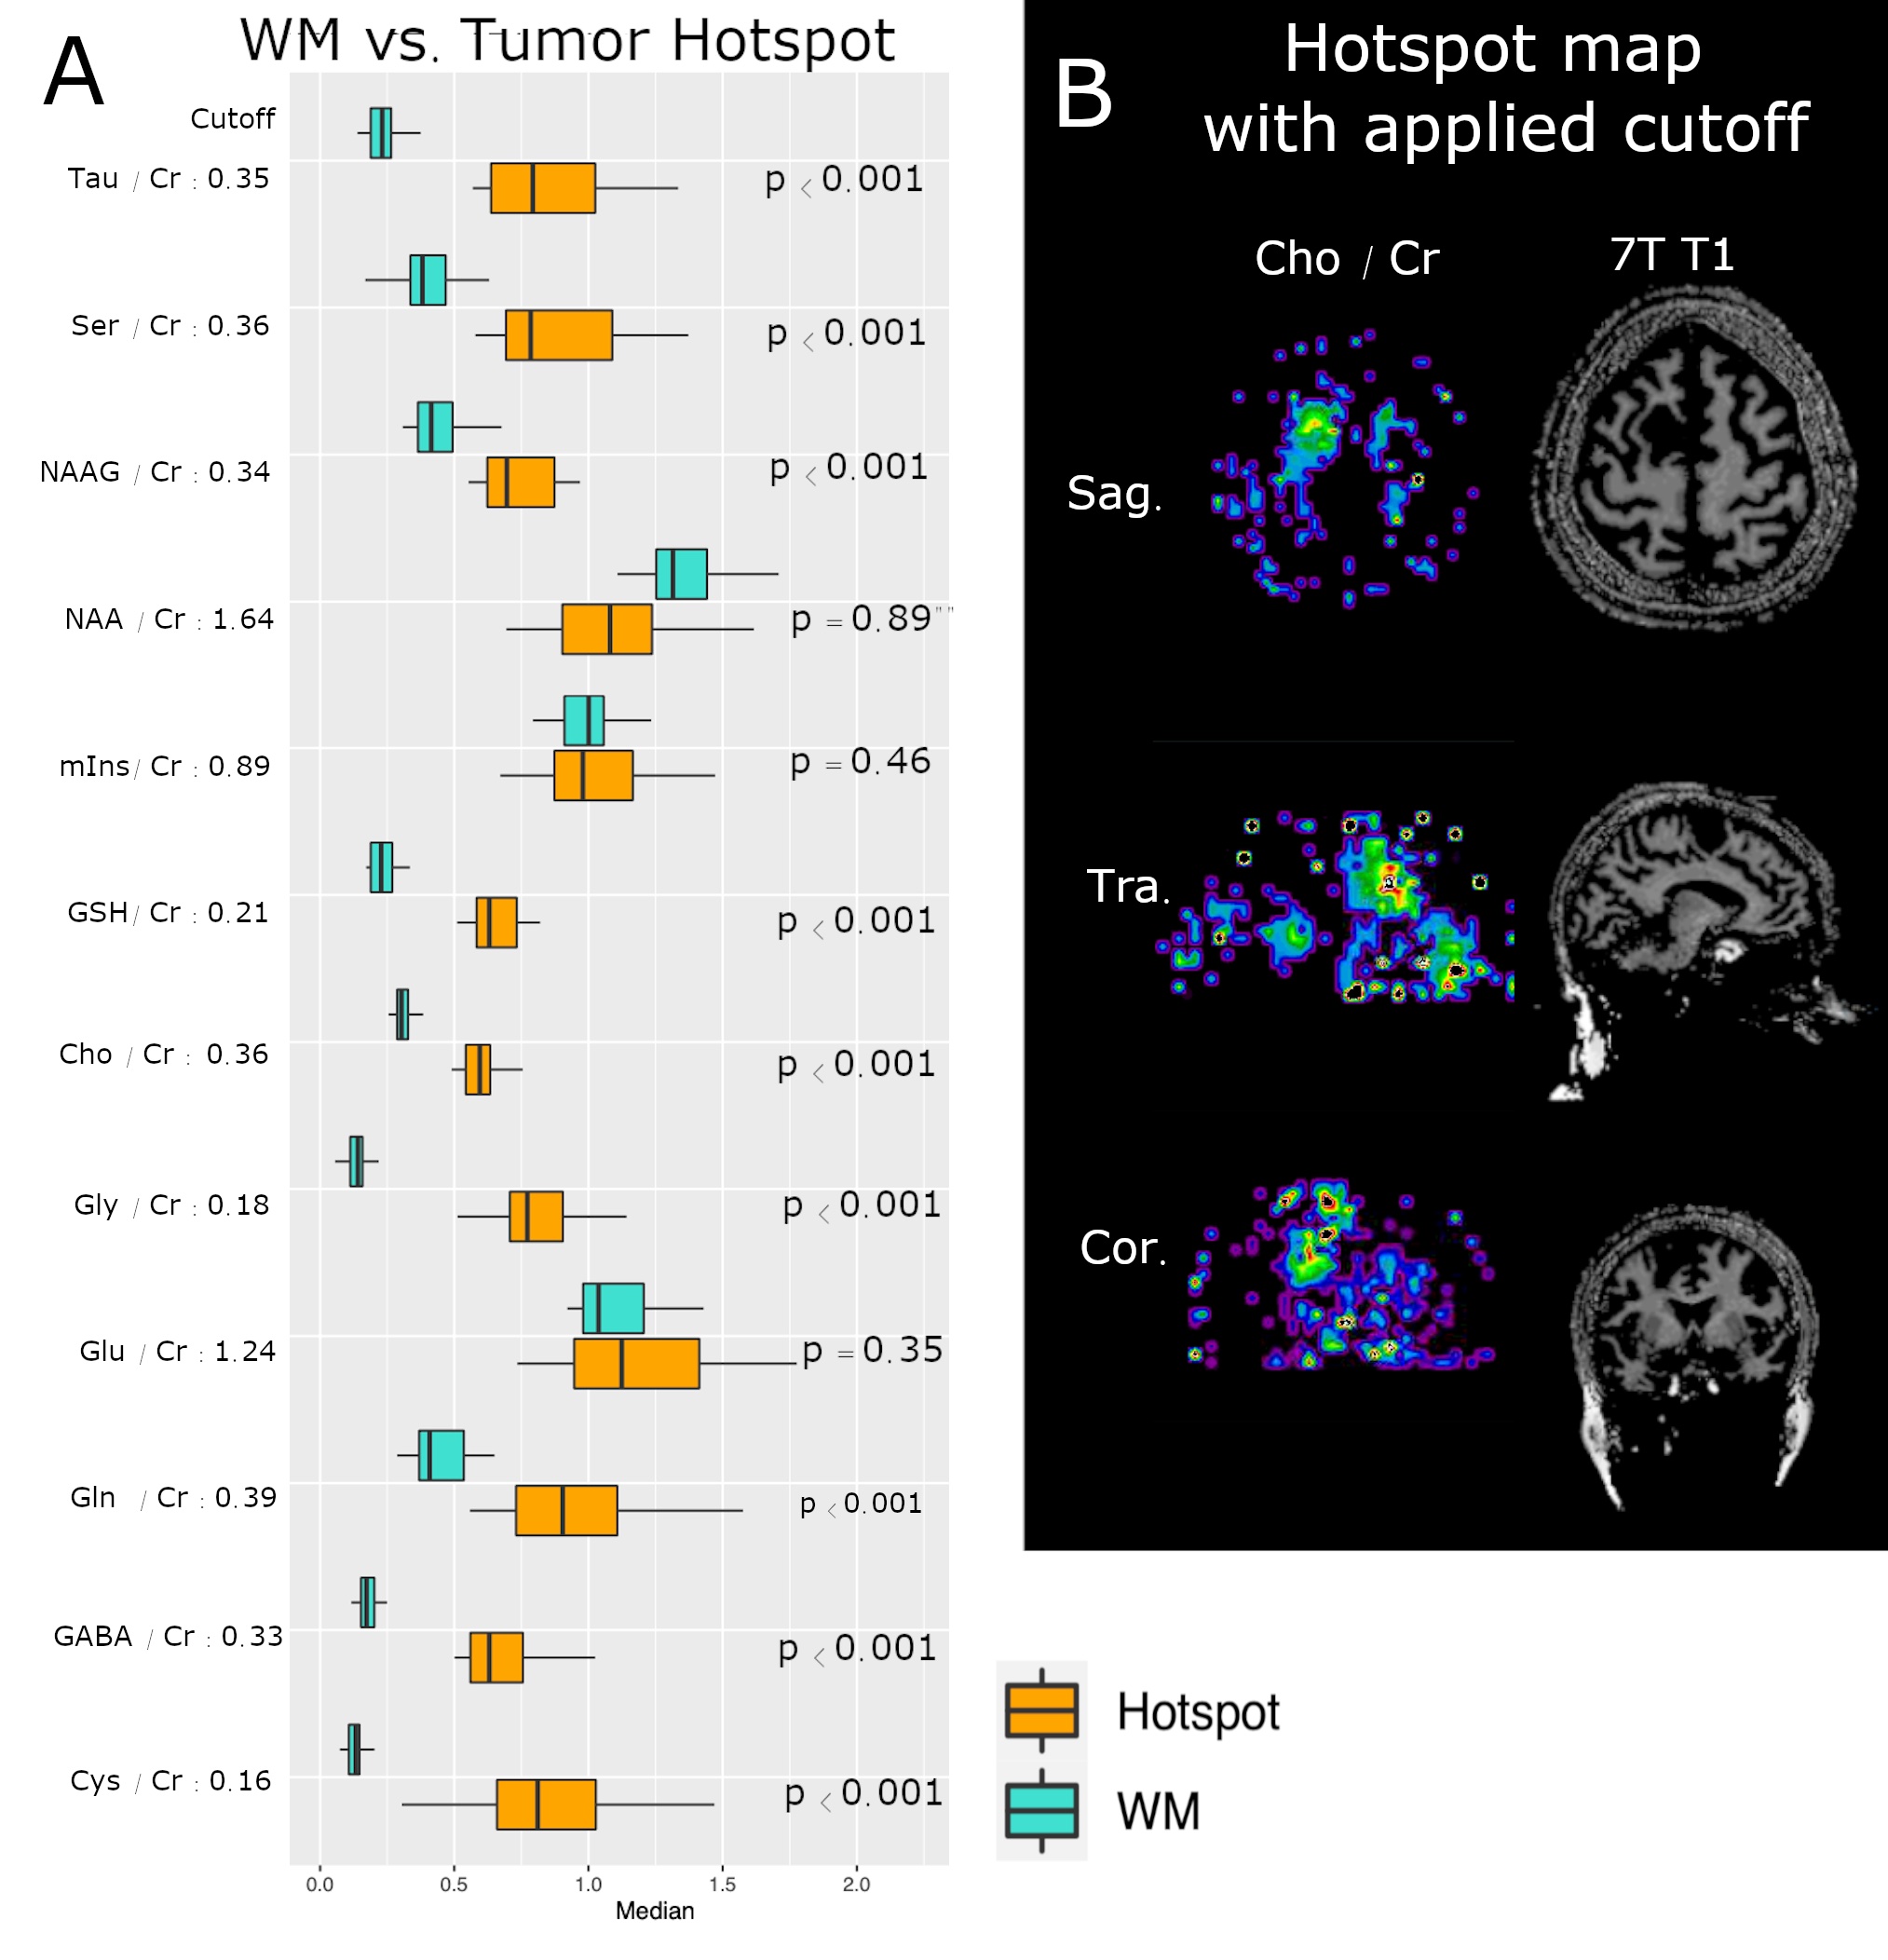
Fig 2 - Boxplots tumor ROI vs WM ROI
Most of the metabolites show significant differences in median voxel values of the tumor hotspot region vs. NAWM (see. A). On the B side, we can see a sample hotspot map of tCho with applied cutoff of 0.36 and the 7T T1 magnitude.