Helge Herthum1, Stefan Hetzer2, Michael Scheel1, Friedemann Paul3, Heiko Tzschätzsch1, Tom Meyer1, Mehrgan Shahryari1, Jürgen Braun4, and Ingolf Sack1
1Experimentelle Radiologie, Charité Universitätsmedizin Berlin, Berlin, Germany, 2Berlin Center for Advanced Neuroimaging (BCAN), Berlin, Germany, 3NeuroCure Clinical Research Center and Clinical and Experimental Multiple Sclerosis Research Center, Berlin, Germany, 4Institut für medizinische Informatik, Charité Universitätsmedizin Berlin, Berlin, Germany
1Experimentelle Radiologie, Charité Universitätsmedizin Berlin, Berlin, Germany, 2Berlin Center for Advanced Neuroimaging (BCAN), Berlin, Germany, 3NeuroCure Clinical Research Center and Clinical and Experimental Multiple Sclerosis Research Center, Berlin, Germany, 4Institut für medizinische Informatik, Charité Universitätsmedizin Berlin, Berlin, Germany
We investigated the
possibility to differentiate lesions of multiple sclerosis from surrounding
tissue by MRE but could not find any evidence for a systematic pattern related
to mechanical changes in MS lesions compared to brain tissue.
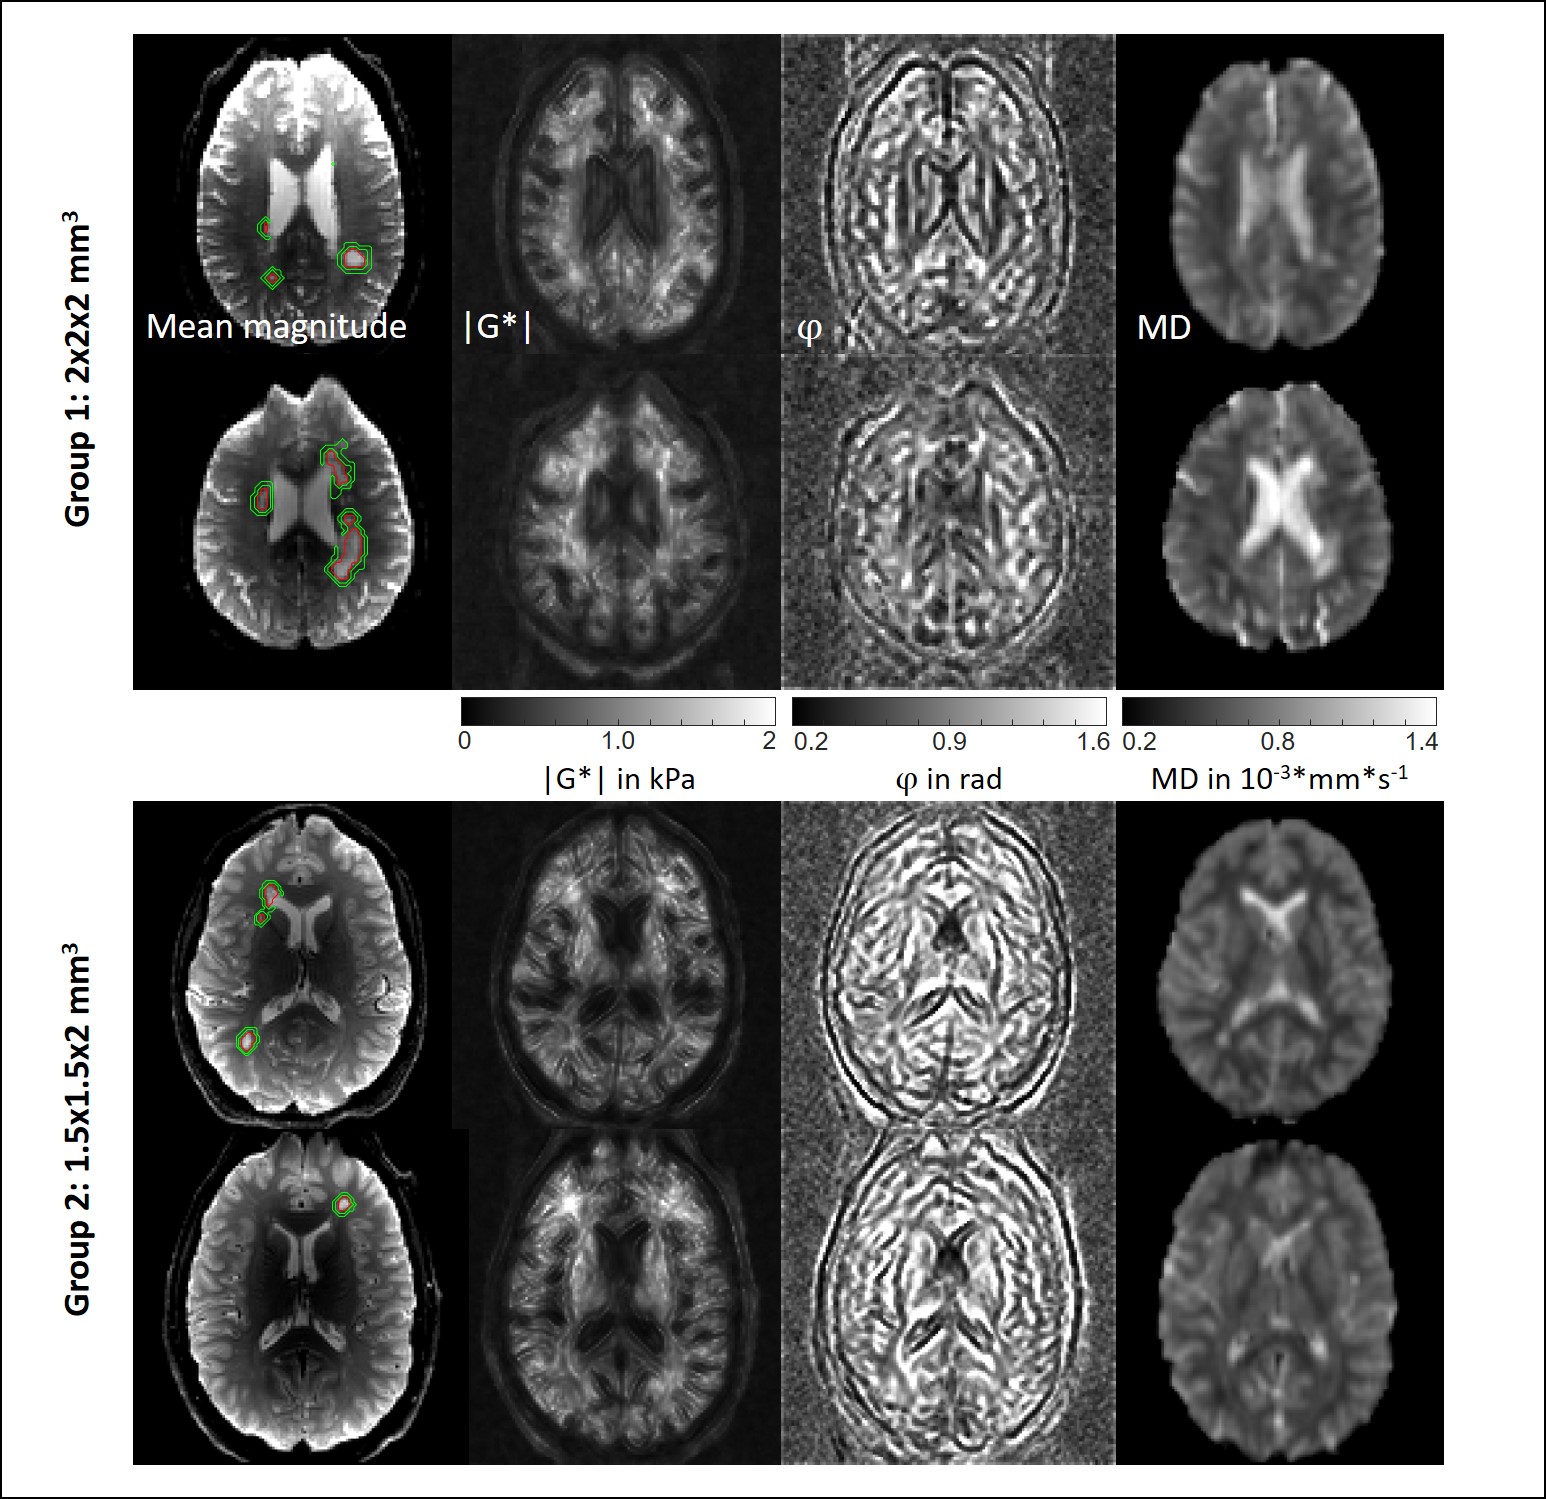
Mean MRE magnitude, maps of |G*|
and φ and the registered mean diffusivity (MD) in two selected slices for one patient from each subgroup. Top rows group
1 (2x2x2 mm3 voxel size). Bottom rows group 2 (1.5x1.5x2 mm3 voxel size). Lesion masks are demarcated in red and the
masks for the surrounding tissue is demarcated in green. Grayscale colorbar
(black to white) is as follows: |G*| in Pa: 0 –
2000, φ in rad: 0.16 – 1.6, MD in 10-3*mm*s-1: 0.2 – 1.4.
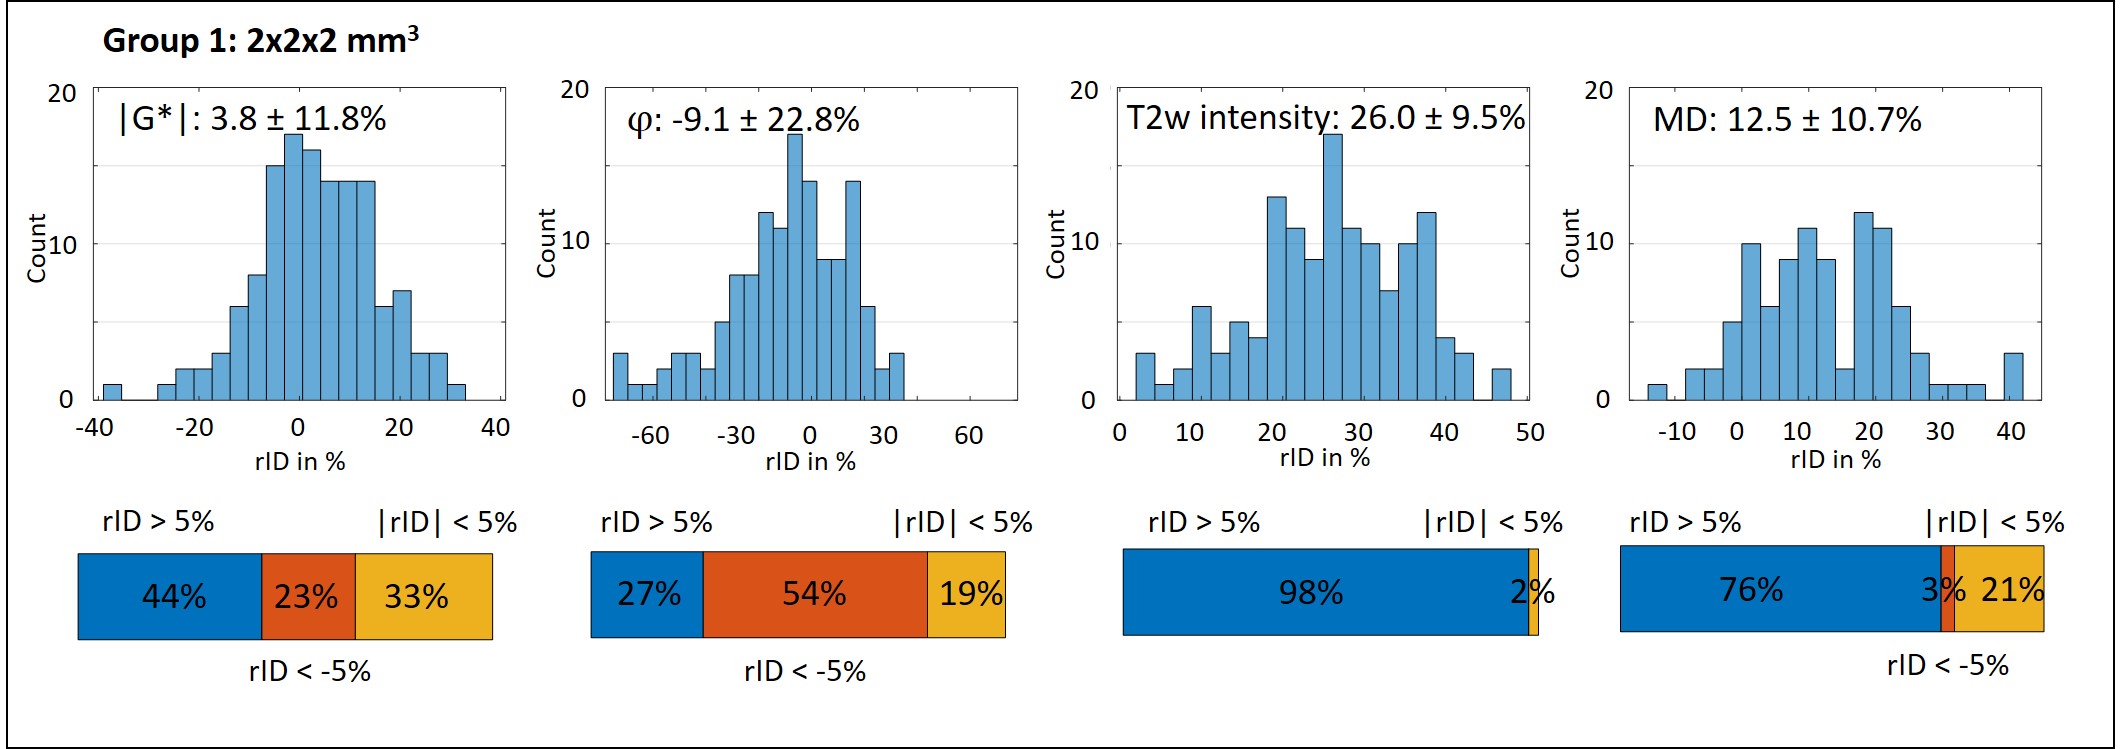
Relative intensity difference (rID) of lesions compared to surrounding
tissue for group 1 (2x2x2 mm3 voxel size) shown as histogram (top)
and bar-chart (bottom) for |G*|, φ, T2w intensity from mean MRE magnitude image
and mean diffusivity (MD). Mean ± SD of rID are given in the figure. rID
thresholds for bar-charts are 5%.