Jakob Jordan1, Gergely Bertalan1, Heiko Tzschätzsch1, Tom Meyer1, Anton Gauert2, Anja Heeren-Hagemann2, Jürgen Braun3, and Ingolf Sack1
1Department of Radiology, Charité - Universitätsmedizin Berlin, Berlin, Germany, 2Department of Hematology/Oncology, Charité - Universitätsmedizin Berlin, Berlin, Germany, 3Institute of Medical Informatic, Charité - Universitätsmedizin Berlin, Berlin, Germany
1Department of Radiology, Charité - Universitätsmedizin Berlin, Berlin, Germany, 2Department of Hematology/Oncology, Charité - Universitätsmedizin Berlin, Berlin, Germany, 3Institute of Medical Informatic, Charité - Universitätsmedizin Berlin, Berlin, Germany
We show
shear wave speed (SWS) maps of the zebrafish brain with an in-plane resolution of 40 × 40 µm³. After defining anatomical regions of interest, we found a mean SWS of 1.2 ± 0.3 m/s for the whole brain, which is surprisingly stiffer than that of
skeletal muscle fiber at 0.89 ± 0.09 m/s.
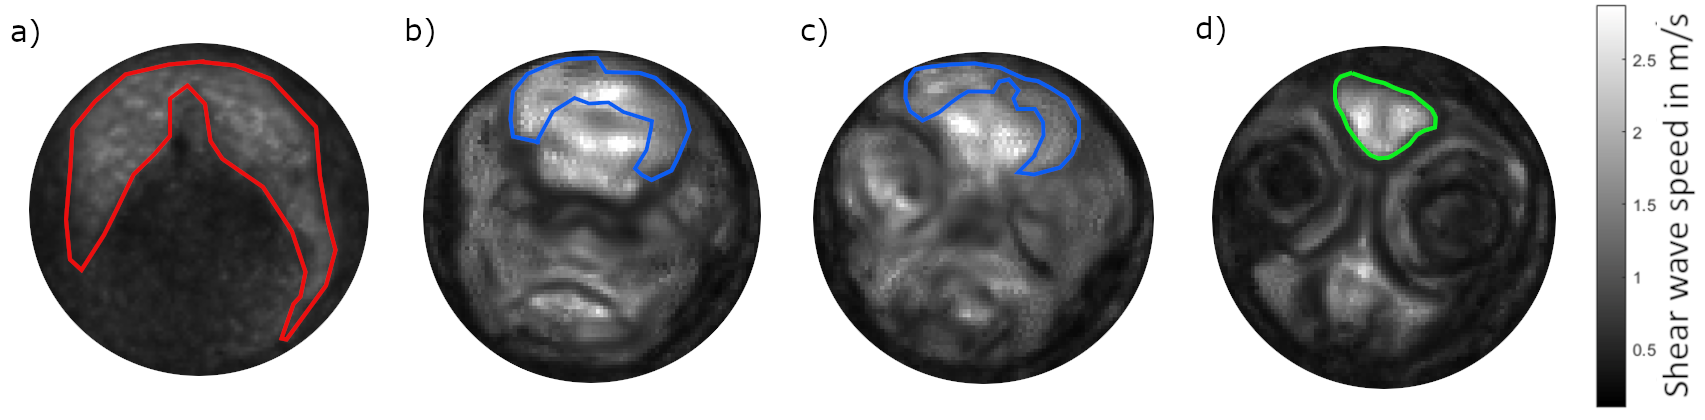
Figure 3:
Shear wave speed maps of the zebrafish brain and skeletal muscle, with
slice a) being most caudal and slice d) most cranial. The optic tectum is
marked in green, the telencephalon in blue and a representative slice through
the muscle in red.
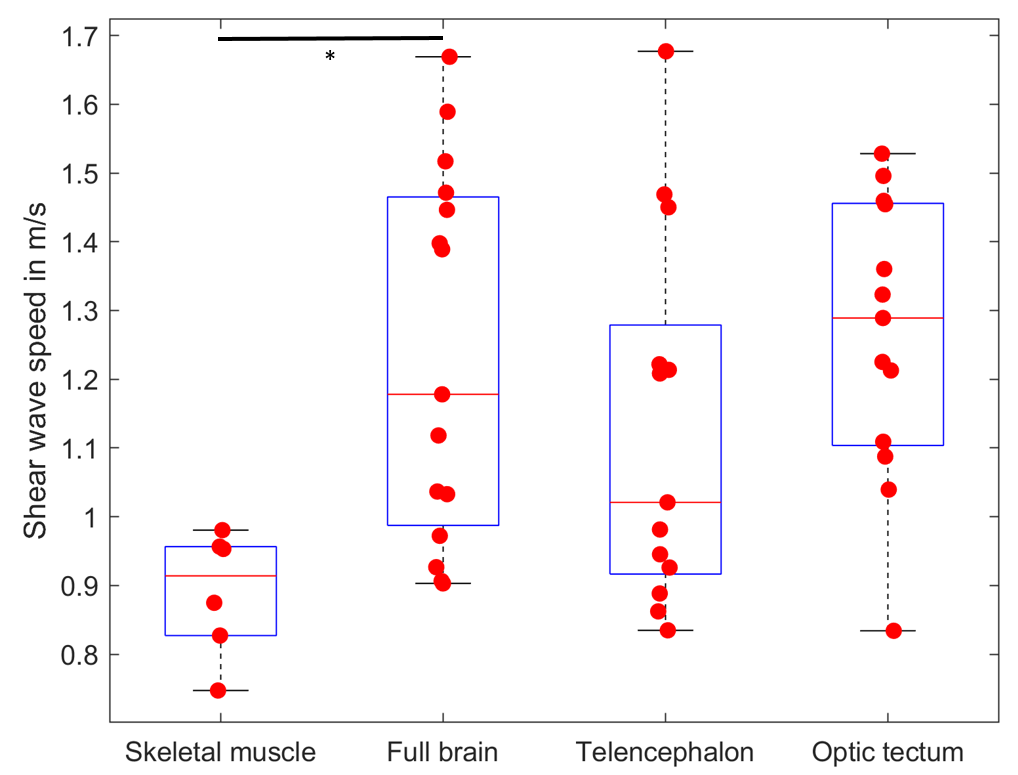
Figure 4:
Mean
SWS of different brain regions and back muscle of sampled zebrafish. Muscle
tissue could not be measured in all fish due to placement in the glass tube.
While we found no statistical difference between identified brain regions, a
clear difference between the full brain and skeletal muscle tissue was found
using the Wilcoxon rank sum test. *indicates p<0.05.