Dong Kyu Kim1, Kyunghwa Han2, Haesung Yoon3, Mi-Jung Lee3, and Hyun Joo Shin3
1Radiology, Armed Forces Capital Hospital, Seongnam, Korea, Republic of, 2Center for Clinical Imaging Data Science, Severance Hospital, Seoul, Korea, Republic of, 3Radiology, Severance Hospital, Seoul, Korea, Republic of
1Radiology, Armed Forces Capital Hospital, Seongnam, Korea, Republic of, 2Center for Clinical Imaging Data Science, Severance Hospital, Seoul, Korea, Republic of, 3Radiology, Severance Hospital, Seoul, Korea, Republic of
This study investigated whether the
difference of driver power amplitudes would influence on the liver stiffness
measurements in pediatric MRE. Liver stiffness values in two different driver
power amplitudes on MRE showed good reliability.
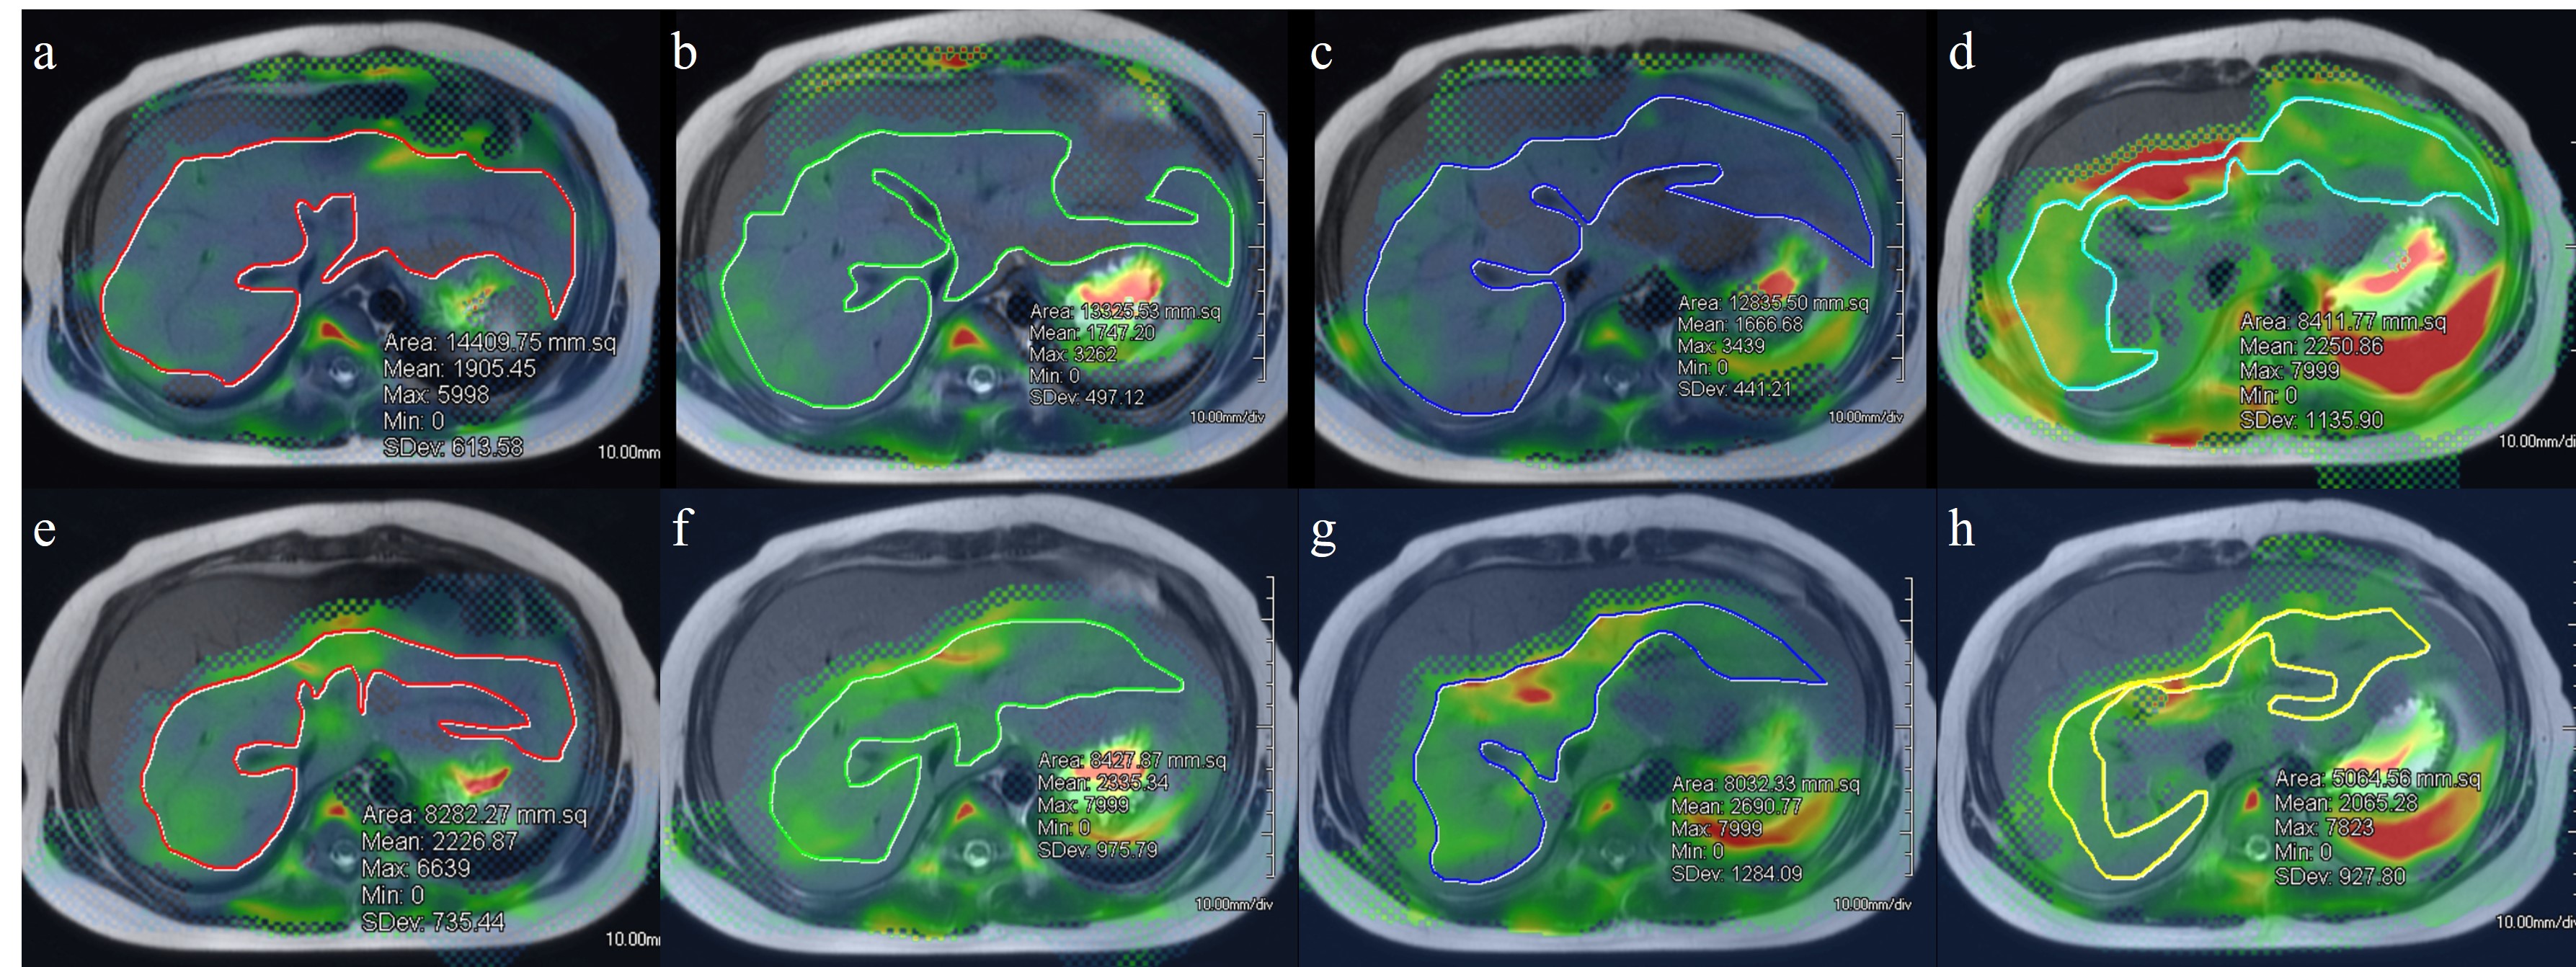
Fusion images of stiffness map and T2-weighted
images of the liver in 11 years old boy who had nonalcoholic steatohepatitis.
His fat signal percentage in the liver MRI was 51%, which was above the normal
limit of 6%. (a-d) Images from 20% driver power amplitudes showed mean liver
stiffness of 1.9 kPa in the area of 122.5 cm2. (e-h) Images from 56%
driver power amplitudes showed mean liver stiffness value of 2.3 kPa in the
area of 74.5 cm2
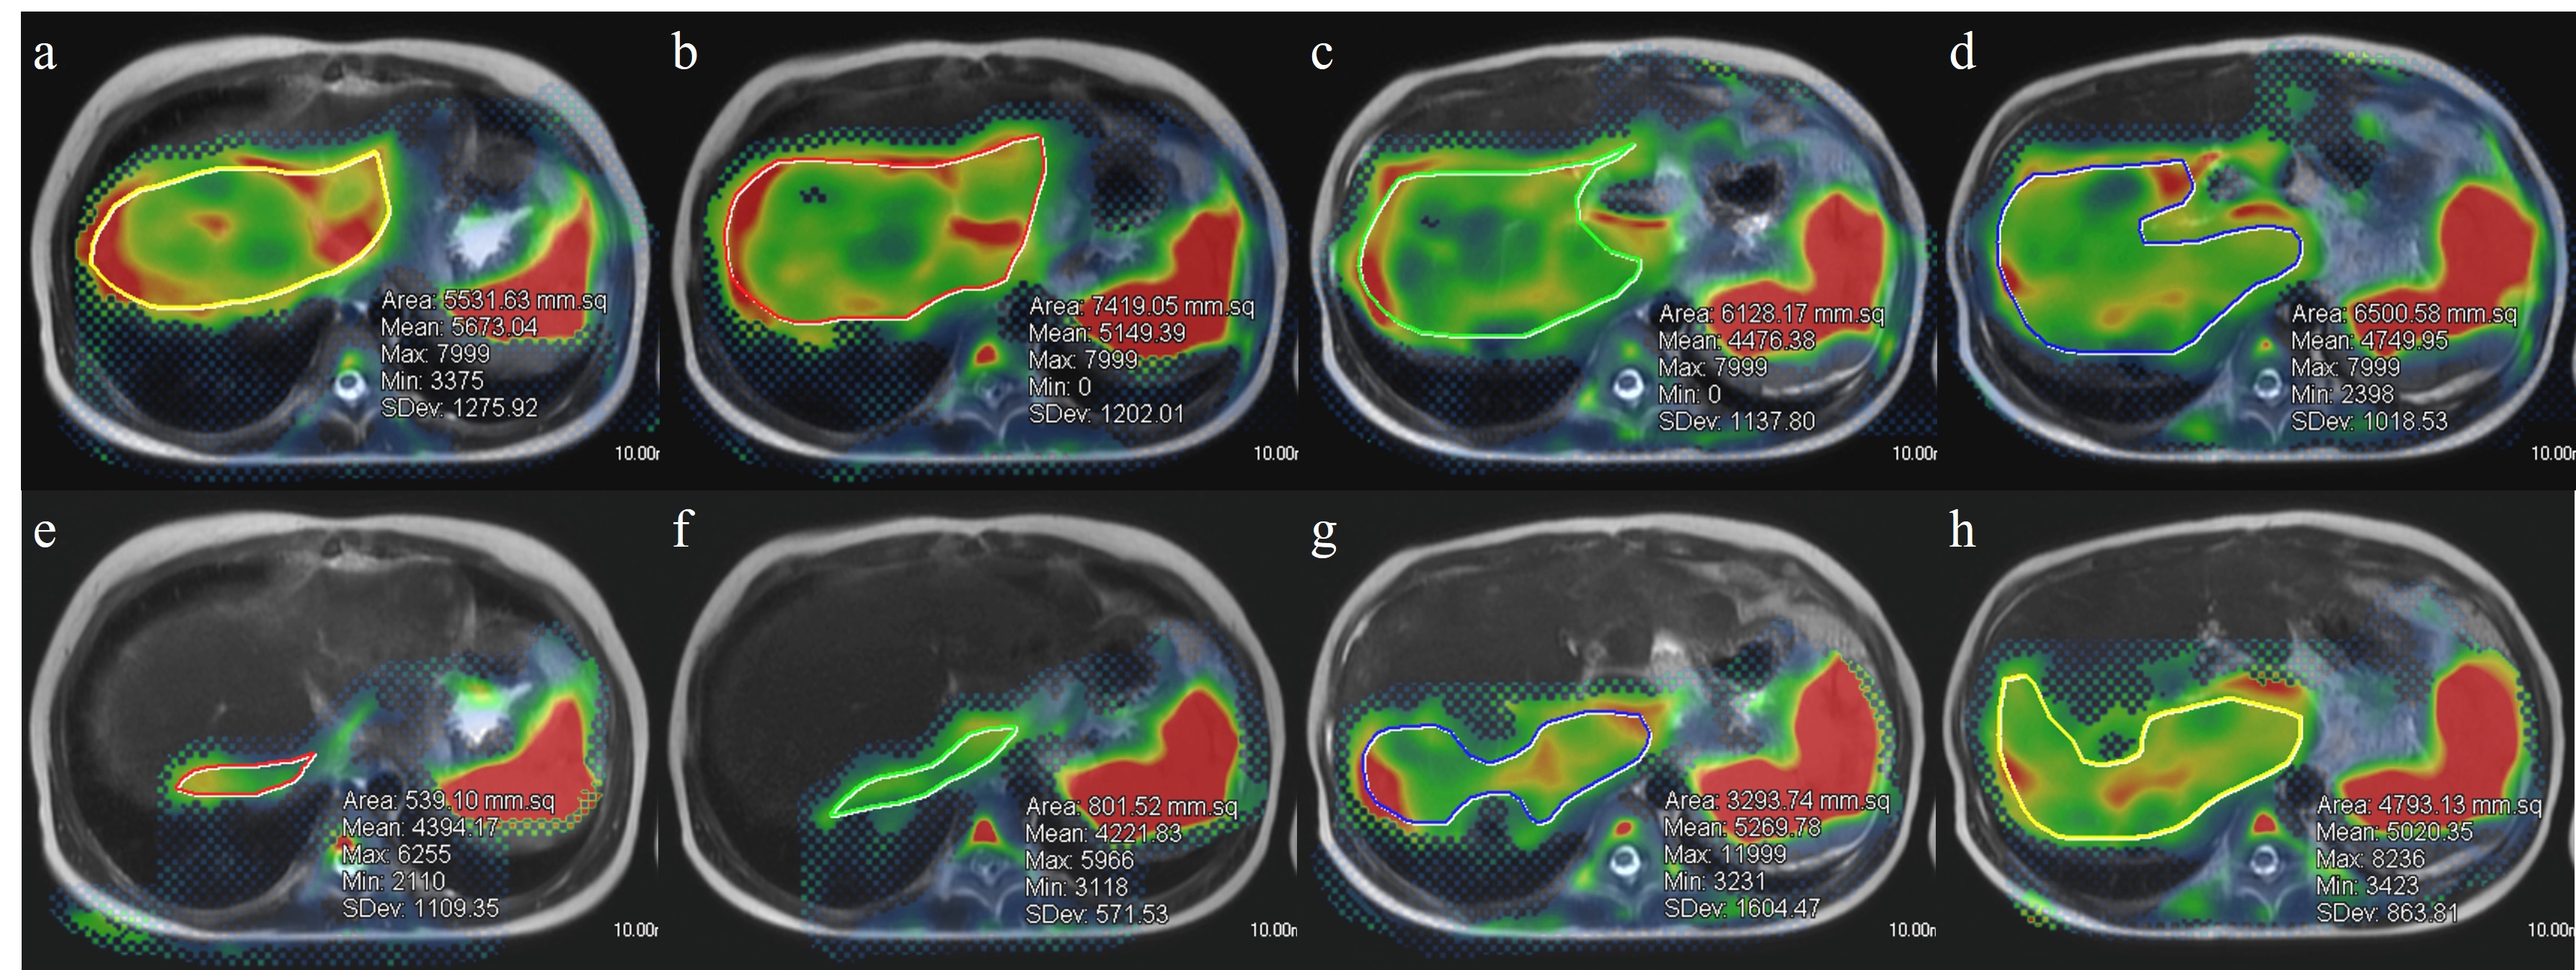
Fusion images of stiffness map and
T2-weighted images of the liver in 11 years old girl who had the Kasai
operation from biliary atresia. (a-d) Images from 20% driver power amplitudes
showed mean liver stiffness of 5.0 kPa in the area of 63.9 cm2.
(e-h) Images from 56% driver power amplitudes showed mean liver stiffness value
of 4.7 kPa in the area of 23.6 cm2