Deirdre McGrath1, Christopher Bradley1, and Susan Francis1
1Sir Peter Mansfield Imaging Centre, University of Nottingham, Nottingham, United Kingdom
1Sir Peter Mansfield Imaging Centre, University of Nottingham, Nottingham, United Kingdom
Magnetic resonance elastography of the kidney is simulated using finite element modelling with an anthropomorphic model, to allow evaluation of the errors on acquired MRE measures, and to inform optimisation of renal MRE methodology.
Figure
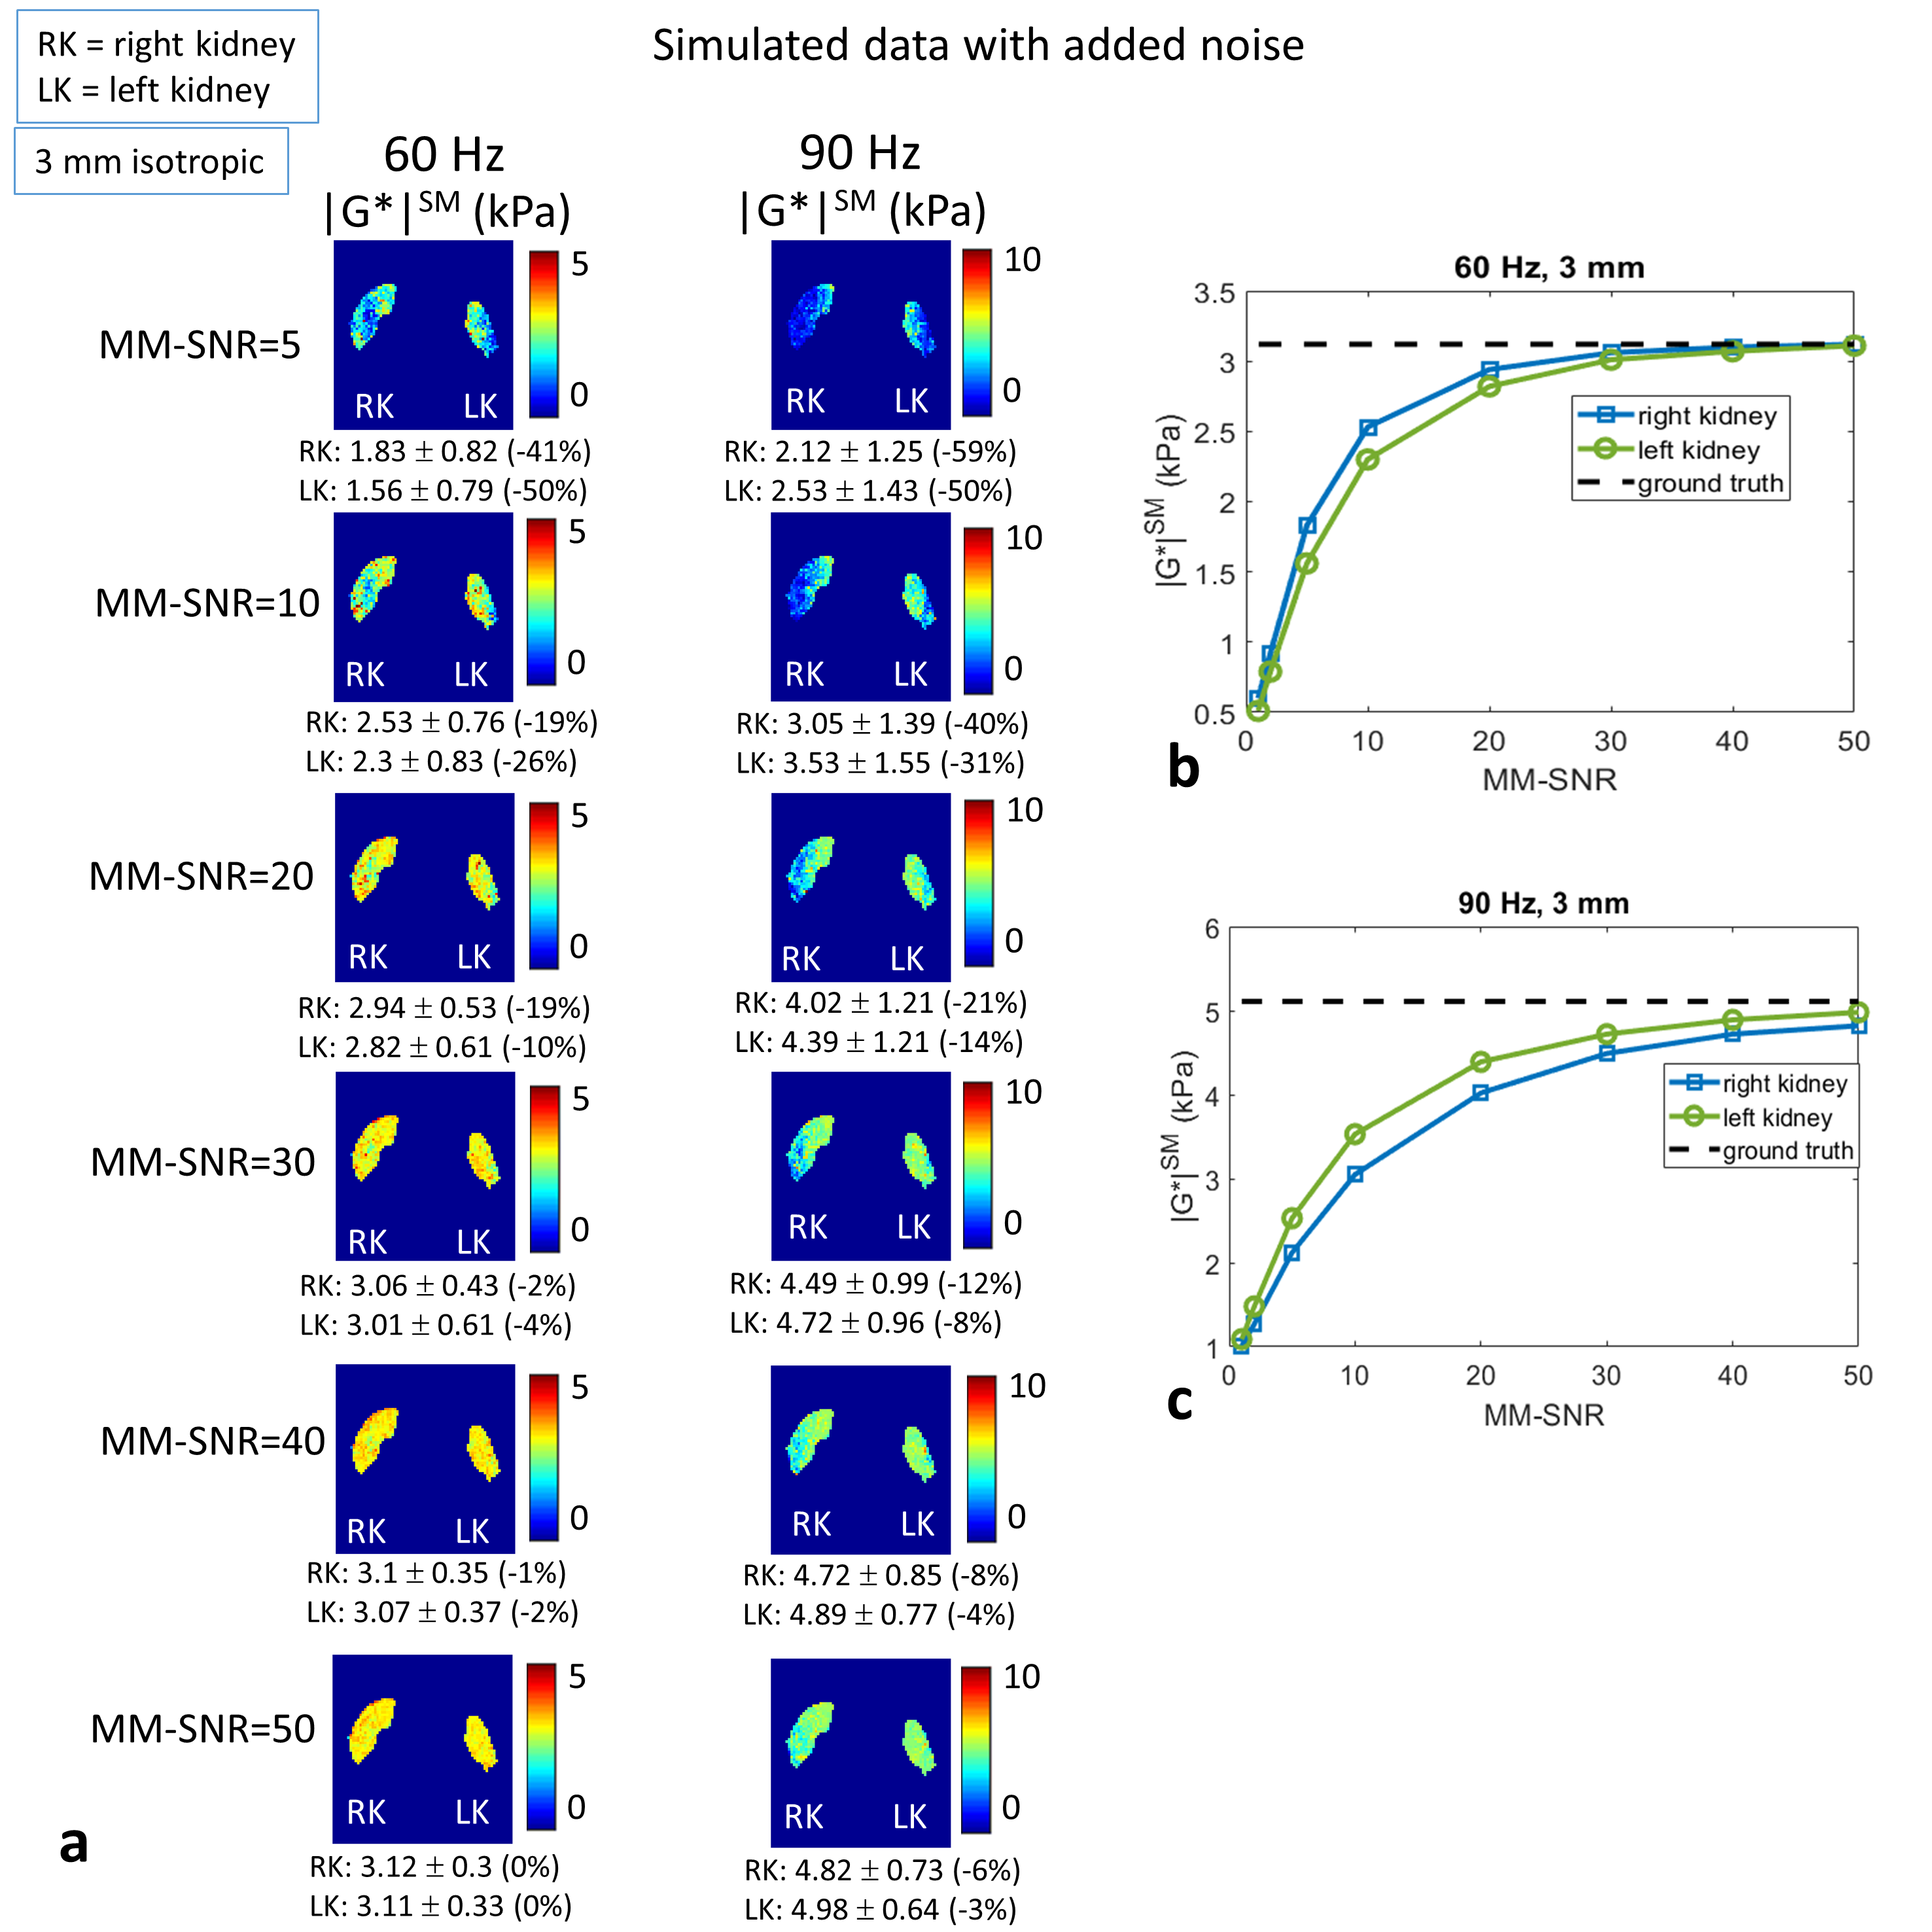
5: Simulated data with added noise (a) Elastograms (with smoothing) for added
noise with MM-SNR level= 5, 10, 20, 30, 40 and 50 (chosen to approximately
match the acquired data); (b) mean |G*|SM over
left and right kidney volumes versus MM-SNR, for 60 Hz, and compared to ground
truth value (dashed line); (c) similar to (b) but for 90 Hz. (Eroded masks are
applied for display and for mean values.)
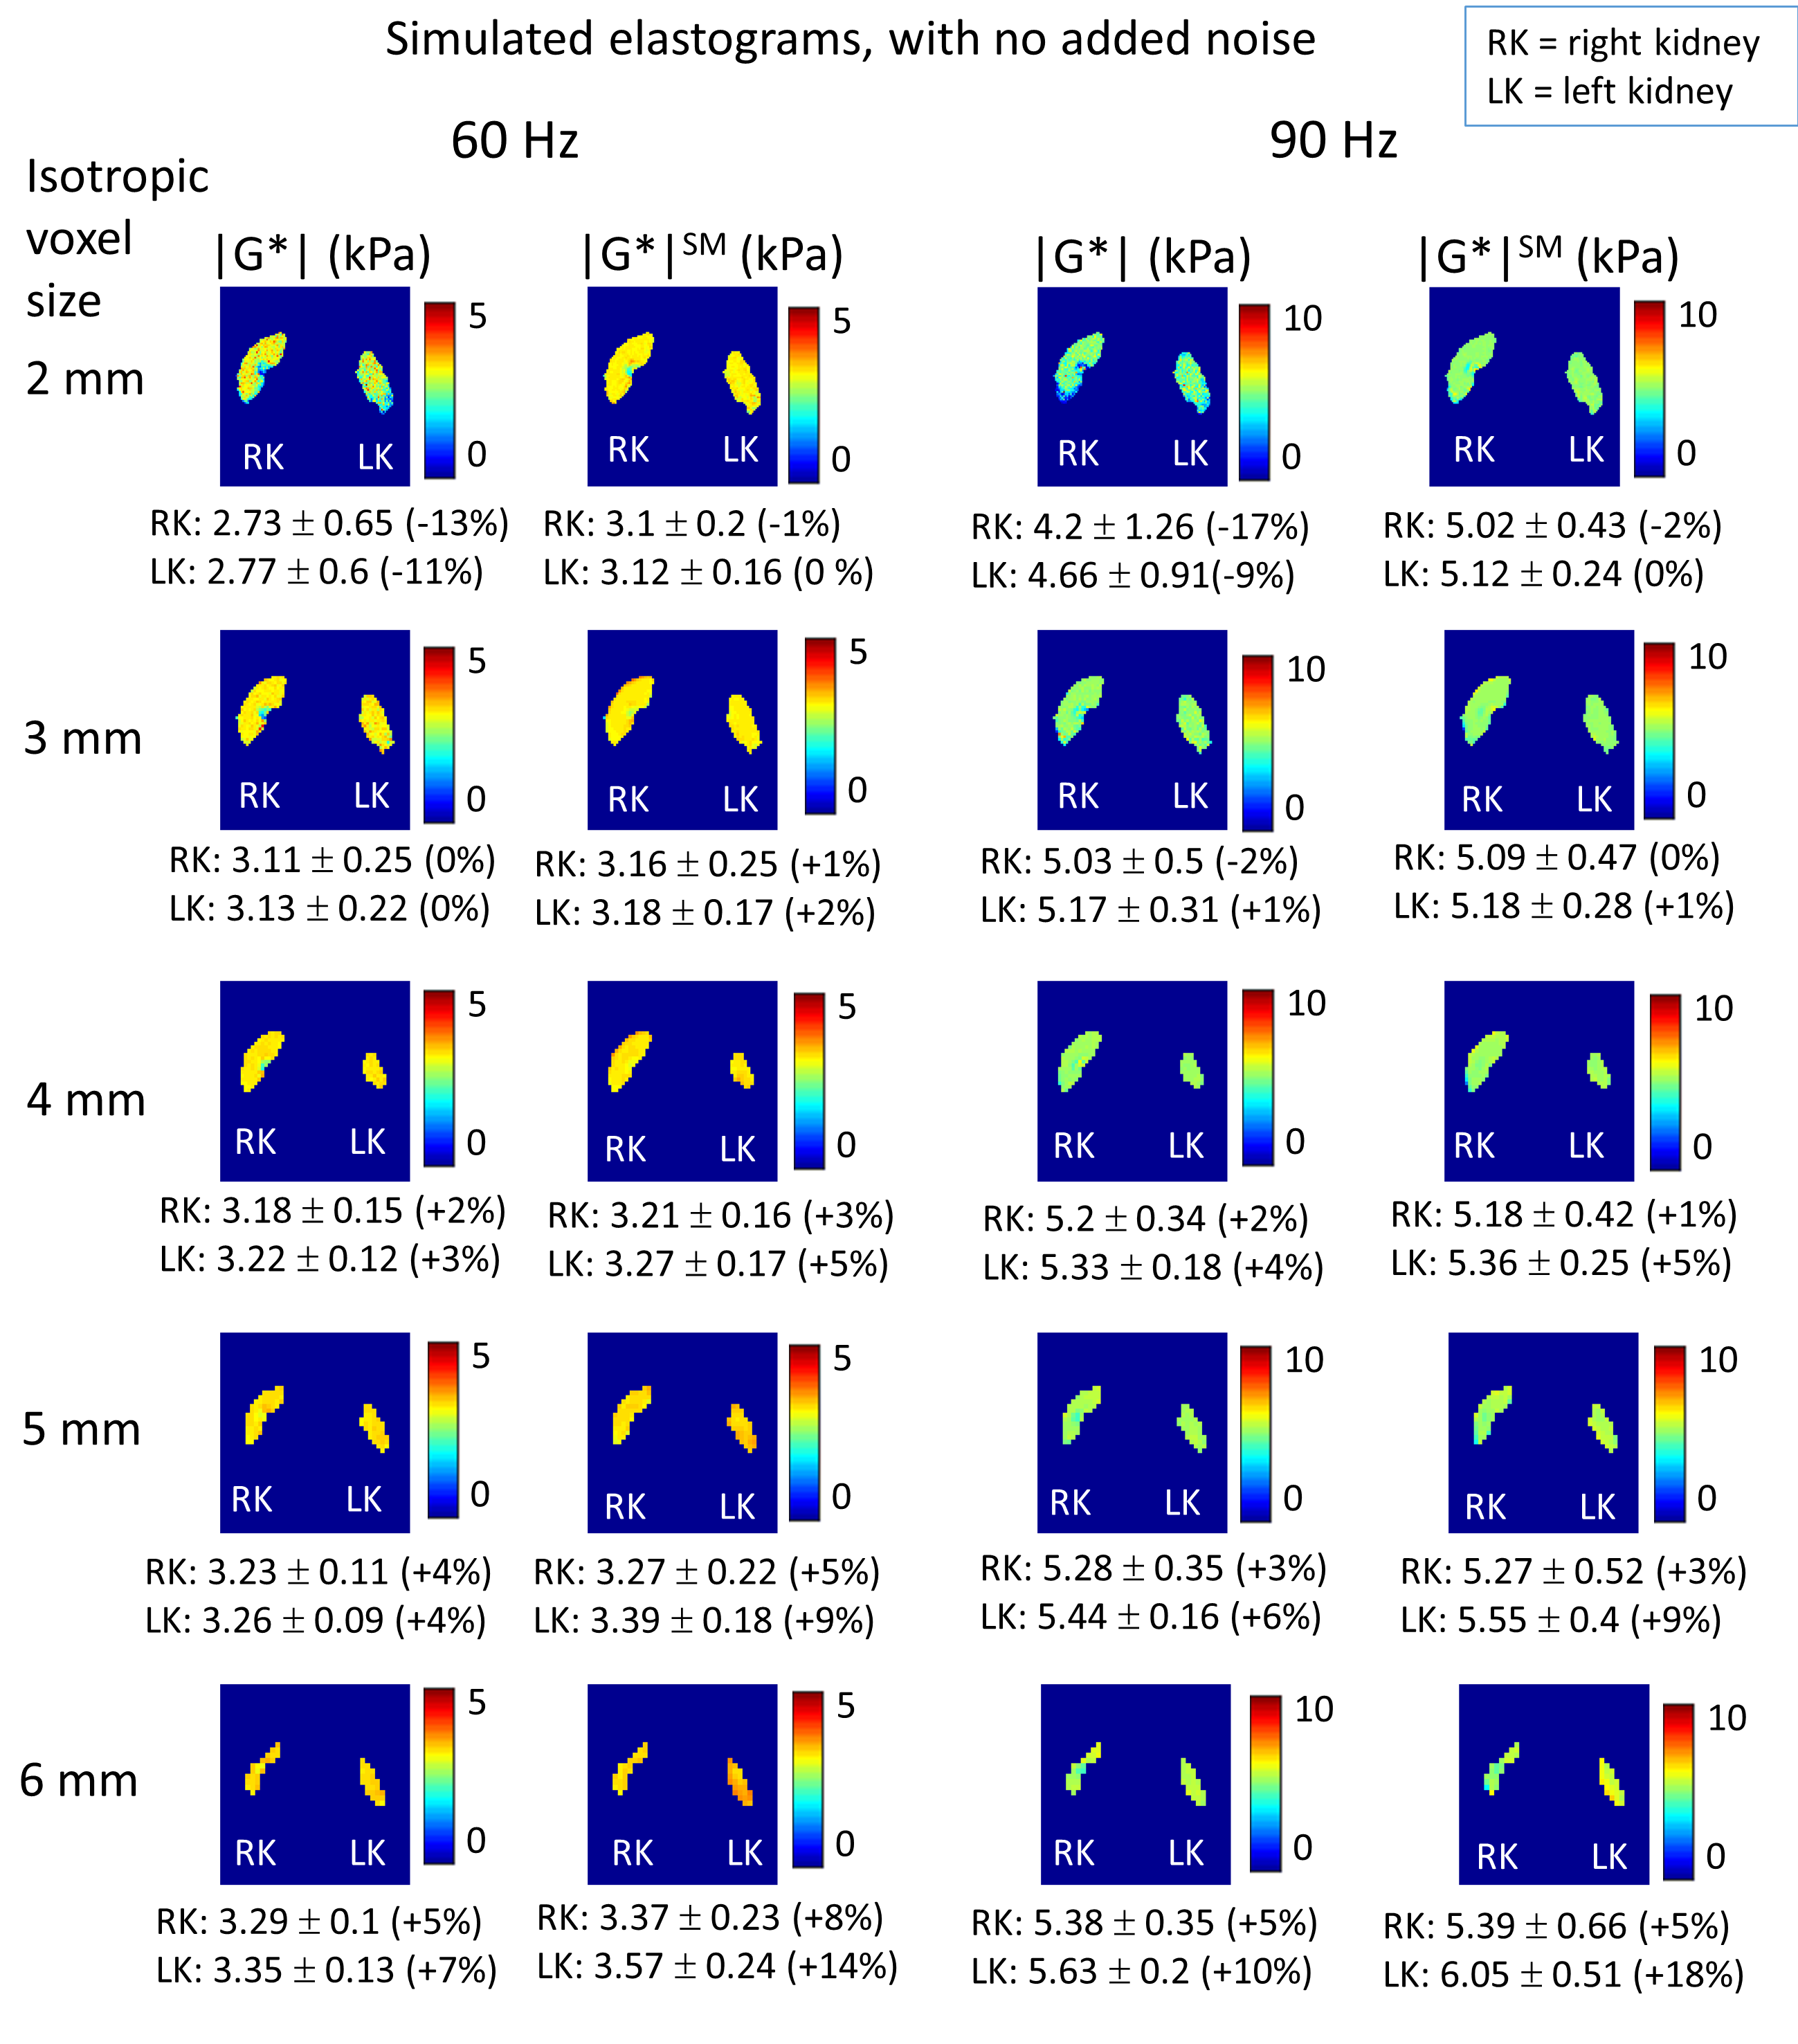
Figure
4: Simulated MRE elastograms (generated by direct inversion on the simulated
displacements) with no added noise for varying voxel dimensions, with mean ±
standard deviation |G*| over kidney volume, without smoothing and with
smoothing of the displacements with a 3D box filter, and % difference of mean
with ground truth. Eroded masks are applied for display and mean value
calculations, to remove edge values which are affected by errors at the simulated
kidney boundaries.