Anne-Sophie van Schelt1, Nienke Wassenaar1, Eric M Schrauben1, Marian Troelstra1,2, Jules L. Nelissen1, Ralph Sinkus2,3, Jaap Stoker4, Aart J Nederveen1, and Jurgen H Runge1
1Radiology and Nuclear Medicine, Amsterdam UMC location AMC, Amsterdam, Netherlands, 2Department of Imaging Sciences and Biomedical Engineering, King's College London, London, United Kingdom, 3Inserm U1148, LVTS, University Paris Diderot, Paris, France, 4Radiology and Nuclear medicine, Amsterdam UMC location AMC, Amsterdam, Netherlands
1Radiology and Nuclear Medicine, Amsterdam UMC location AMC, Amsterdam, Netherlands, 2Department of Imaging Sciences and Biomedical Engineering, King's College London, London, United Kingdom, 3Inserm U1148, LVTS, University Paris Diderot, Paris, France, 4Radiology and Nuclear medicine, Amsterdam UMC location AMC, Amsterdam, Netherlands
The aim of this study is to optimize pancreatic GRE-MRE to provide an in-depth analysis of the propagation and registration of shear waves using a combination of frequency, wave-phase offsets, and TE. The optimal combination was found to be at 40Hz, TE6.9ms and 4 or 5 offsets.

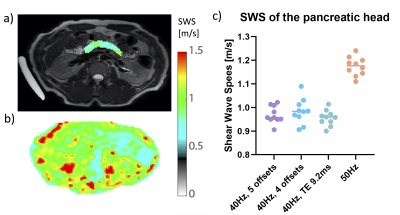
Figure 4. a) Example T2 weighted image with the SWS map on the pancreas (top left) b) and SWS map (bottom left) in one volunteer. c) The average SWS per scan-protocol. The SWS is higher for 50Hz as expected compared to scans using 40Hz.

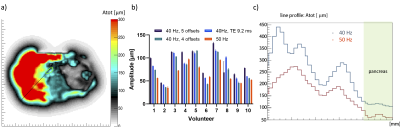
Figure 1. a) Example shear wave amplitude map. The line-profile is given in black. b) The average amplitude measured in the pancreas head plotted for each volunteer for each scan. c) The shear wave amplitude was measured and a line-profile was made from the liver to the pancreatic head. The blue line indicates the line-profile for a protocol with a frequency of 40Hz and the red line is for a frequency of 50Hz.
