Zhongwei Chen1, Yang Zhang2, Jiejie Zhou1, Youfan Zhao1, Haiwei Miao1, Huiru Liu1, Shuxin Ye1, Nina Xu1, Meihao Wang1, and Min-Ying Su2
1Department of Radiology, The First Affiliated Hospital of Wenzhou Medical University, wenzhou, China, 2Department of Radiological Sciences, University of California, Irvine, CA, United States
1Department of Radiology, The First Affiliated Hospital of Wenzhou Medical University, wenzhou, China, 2Department of Radiological Sciences, University of California, Irvine, CA, United States
The model built based on all MRI and mammography features yielded the highest accuracy and had significantly better diagnostic performance than BI-RADS using threshold of 4A or 4B.
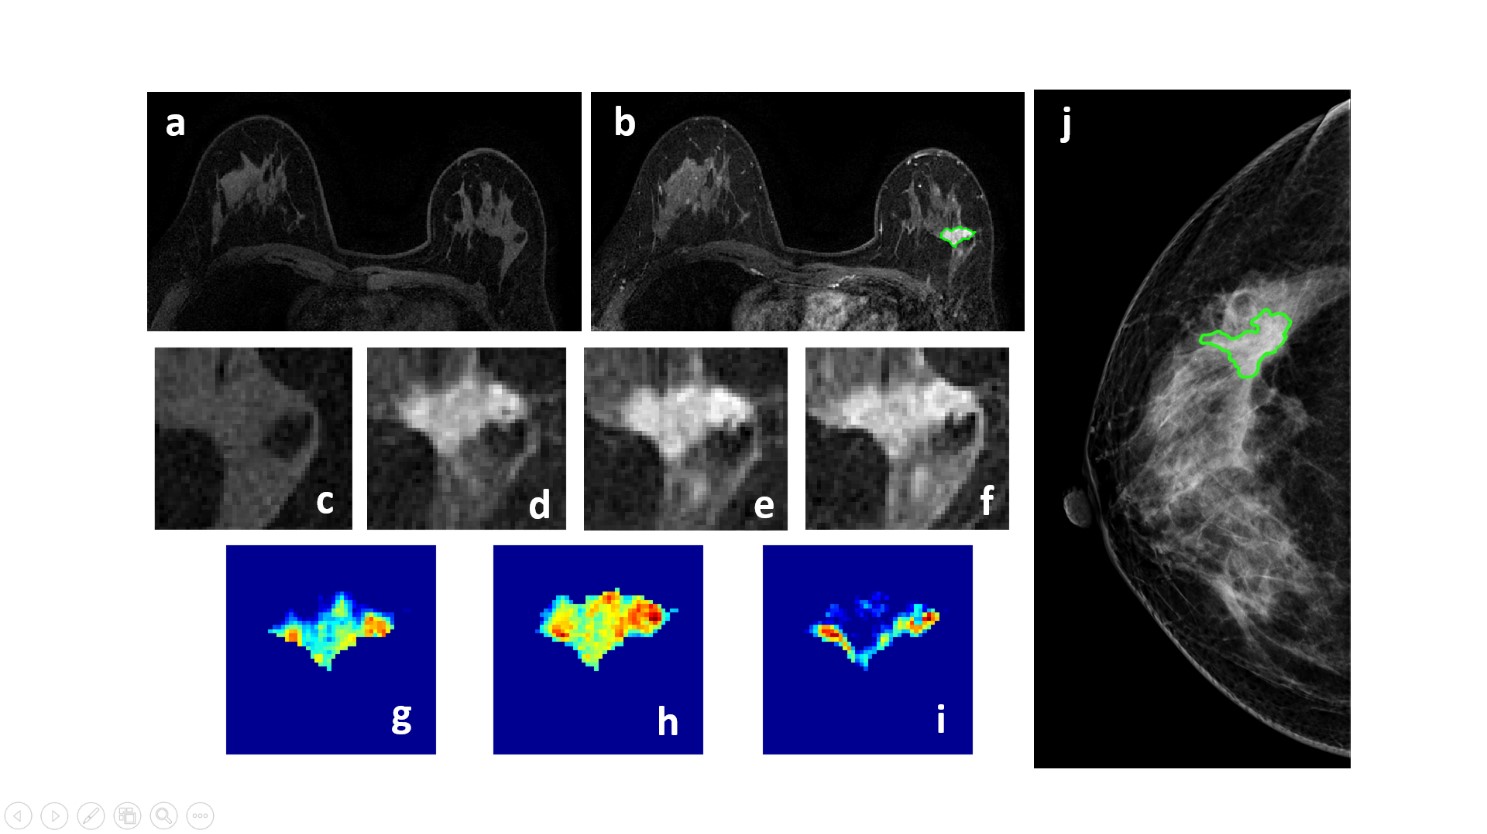
Figure 1: A 50-year-old patient with a malignant cancer showing smooth boundary. (a) F1 Precontrast image. (b) The F2 postcontrast image. (c) The F1 precontrast image. (d) The F2 postcontrast image. (e) The F3 postcontrast image. (f) The last F6 postcontrast image,showing persistent enhancement with increased intensity over time. (g) The washin signal enhancement map F2-F1. (h) The F3-F1 signal enhancement map. (i) The washout F6-F3 map. (j) The corresponding CC view mammography, the lesion mass was outlined by green line.
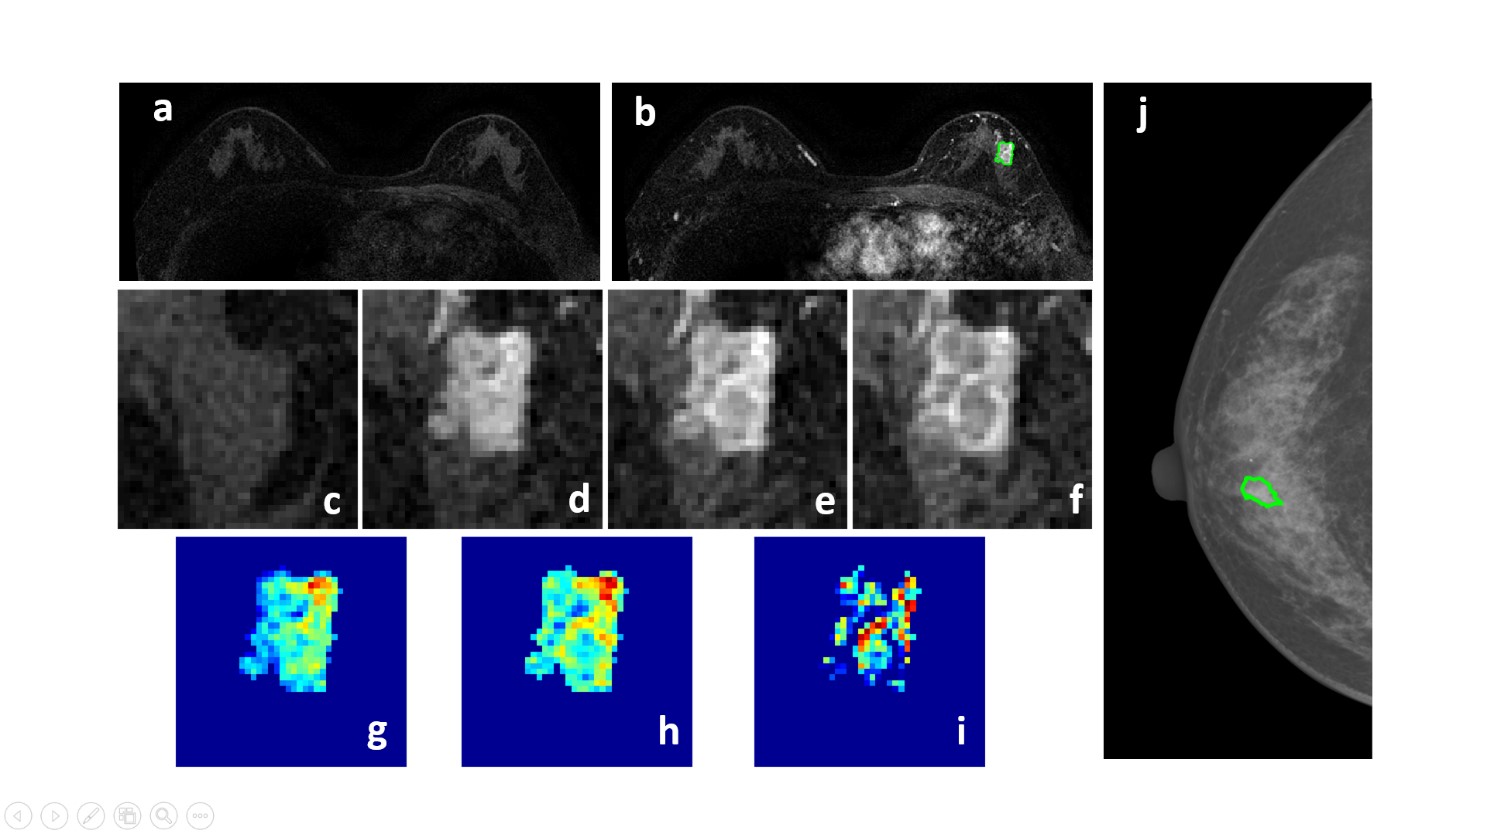
Figure 2: A 58-year-old patient with a malignant cancer showing smooth boundary. (a) F1 Precontrast image. (b) The F2 postcontrast image. (c) The F1 precontrast image. (d) The F2 postcontrast image. (e) The F3 postcontrast image. (f) The last F6 postcontrast image, showing persistent enhancement with increased intensity over time. (g) The washin signal enhancement map F2-F1. (h) The F3-F1 signal enhancement map. (i) The washout F6-F3 map. (j) The corresponding CC view mammography, the lesion mass was outlined by green line.