Yan-Lin Liu1, Yang Zhang1,2, Jeon-Hor Chen1,3, Siwa Chan4, Jiejie Zhou5, Meihao Wang5, and Min-Ying Su1
1Department of Radiological Sciences, University of California, Irvine, CA, United States, 2Department of Radiation Oncology, Rutgers-Cancer Institute of New Jersey, Robert Wood Johnson Medical School, New Brunswick, NJ, United States, 3Department of Radiology, E-Da Hospital and I-Shou University, Kaohsiung, Taiwan, 4Department of Medical Imaging, Taichung Tzu-Chi Hospital, Taichung, Taiwan, 5Department of Radiology, The First Affiliate Hospital of Wenzhou Medical University, Wenzhou, China
1Department of Radiological Sciences, University of California, Irvine, CA, United States, 2Department of Radiation Oncology, Rutgers-Cancer Institute of New Jersey, Robert Wood Johnson Medical School, New Brunswick, NJ, United States, 3Department of Radiology, E-Da Hospital and I-Shou University, Kaohsiung, Taiwan, 4Department of Medical Imaging, Taichung Tzu-Chi Hospital, Taichung, Taiwan, 5Department of Radiology, The First Affiliate Hospital of Wenzhou Medical University, Wenzhou, China
Patients were classified into three molecular Subtypes. Five machine learning algorithms were implemented to build models. For TN vs. Non-TN, accuracy was 91.0% in training and 88.2% in testing datasets. For HER2+ vs. HER2-, accuracy was 90.4% in training and 86.2% in testing datasets.
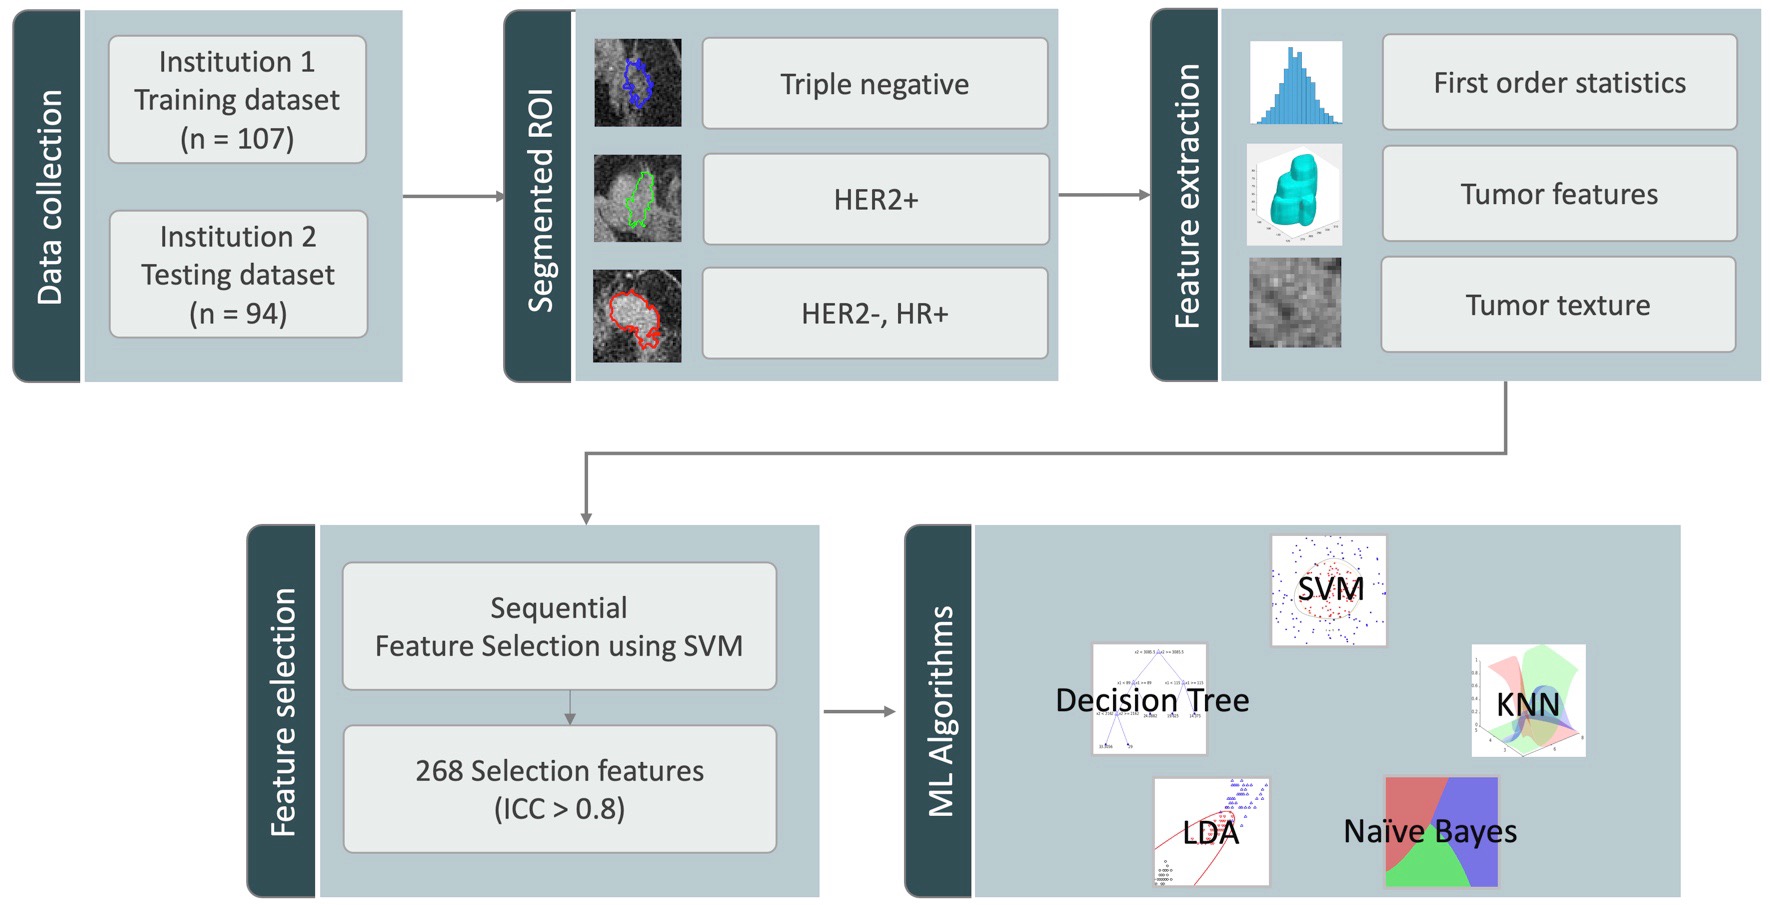
Figure 1: The flowchart of the experimental design. The tumor is segmented by Fuzzy-C-means clustering algorithm on F2 post-contrast image, and then the tumor ROI is mapped to 3 generated DCE parametric maps. On each map, 32 first-order and 75 texture parameters are extracted using the PyRadiomics. For each case, a total of 268 radiomics features with ICC ³ 0.8 are used to build models using five machine learning algorithms to differentiate three different molecular subtypes.
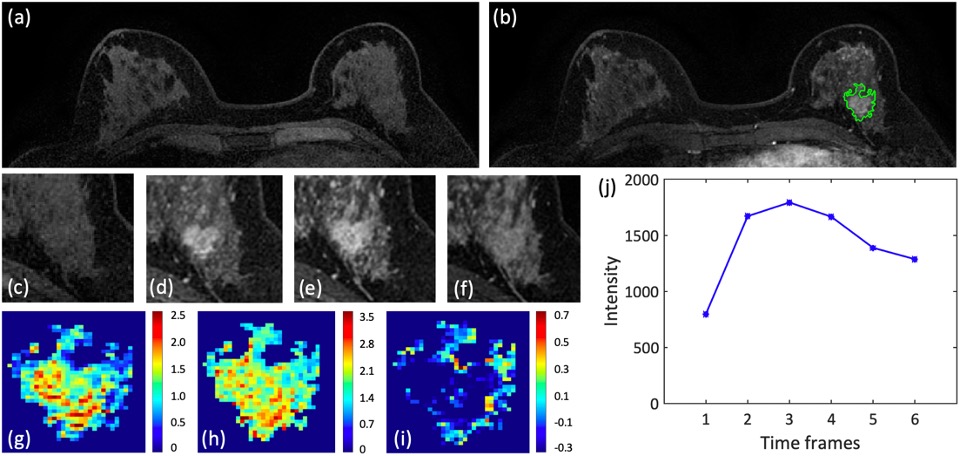
Figure 2: A 48-year-old patient with an invasive ductal cancer (TN). (a) F1 Pre-contrast image. (b) F2 post-contrast image. (c-i): The zoom-in smallest bounding box containing the tumor. (c) F1 pre-contrast, (d) F2 post-contrast, (e) F3 post-contrast, (f) The last F6 post-contrast image. (g) The wash-in signal enhancement map F2-F1, (h) The maximum F3-F1 signal enhancement map, (i) The wash-out F6-F3 map. (J) The DCE time course shows a typical wash-out pattern.