Pablo F. Damasceno1,2, Tatiana Kelil1,2, Rutwik Shah1,2, Bruno Astuto Arouche Nunes1,2, Jason Crane1,2, and Sharmila Majumdar1,2
1Radiology and Biomedical Imaging, University of California San Francisco, San Francisco, CA, United States, 2Center for Intelligent Imaging, University of California San Francisco, San Francisco, CA, United States
1Radiology and Biomedical Imaging, University of California San Francisco, San Francisco, CA, United States, 2Center for Intelligent Imaging, University of California San Francisco, San Francisco, CA, United States
We use deep learning to compute FGT amounts in breast MRI and evaluate its relationship to qualitative FGT categories assigned by a radiologist at the time of examination, opening the door for a parsimonious relationship between qualitative classes and quantitative density values.
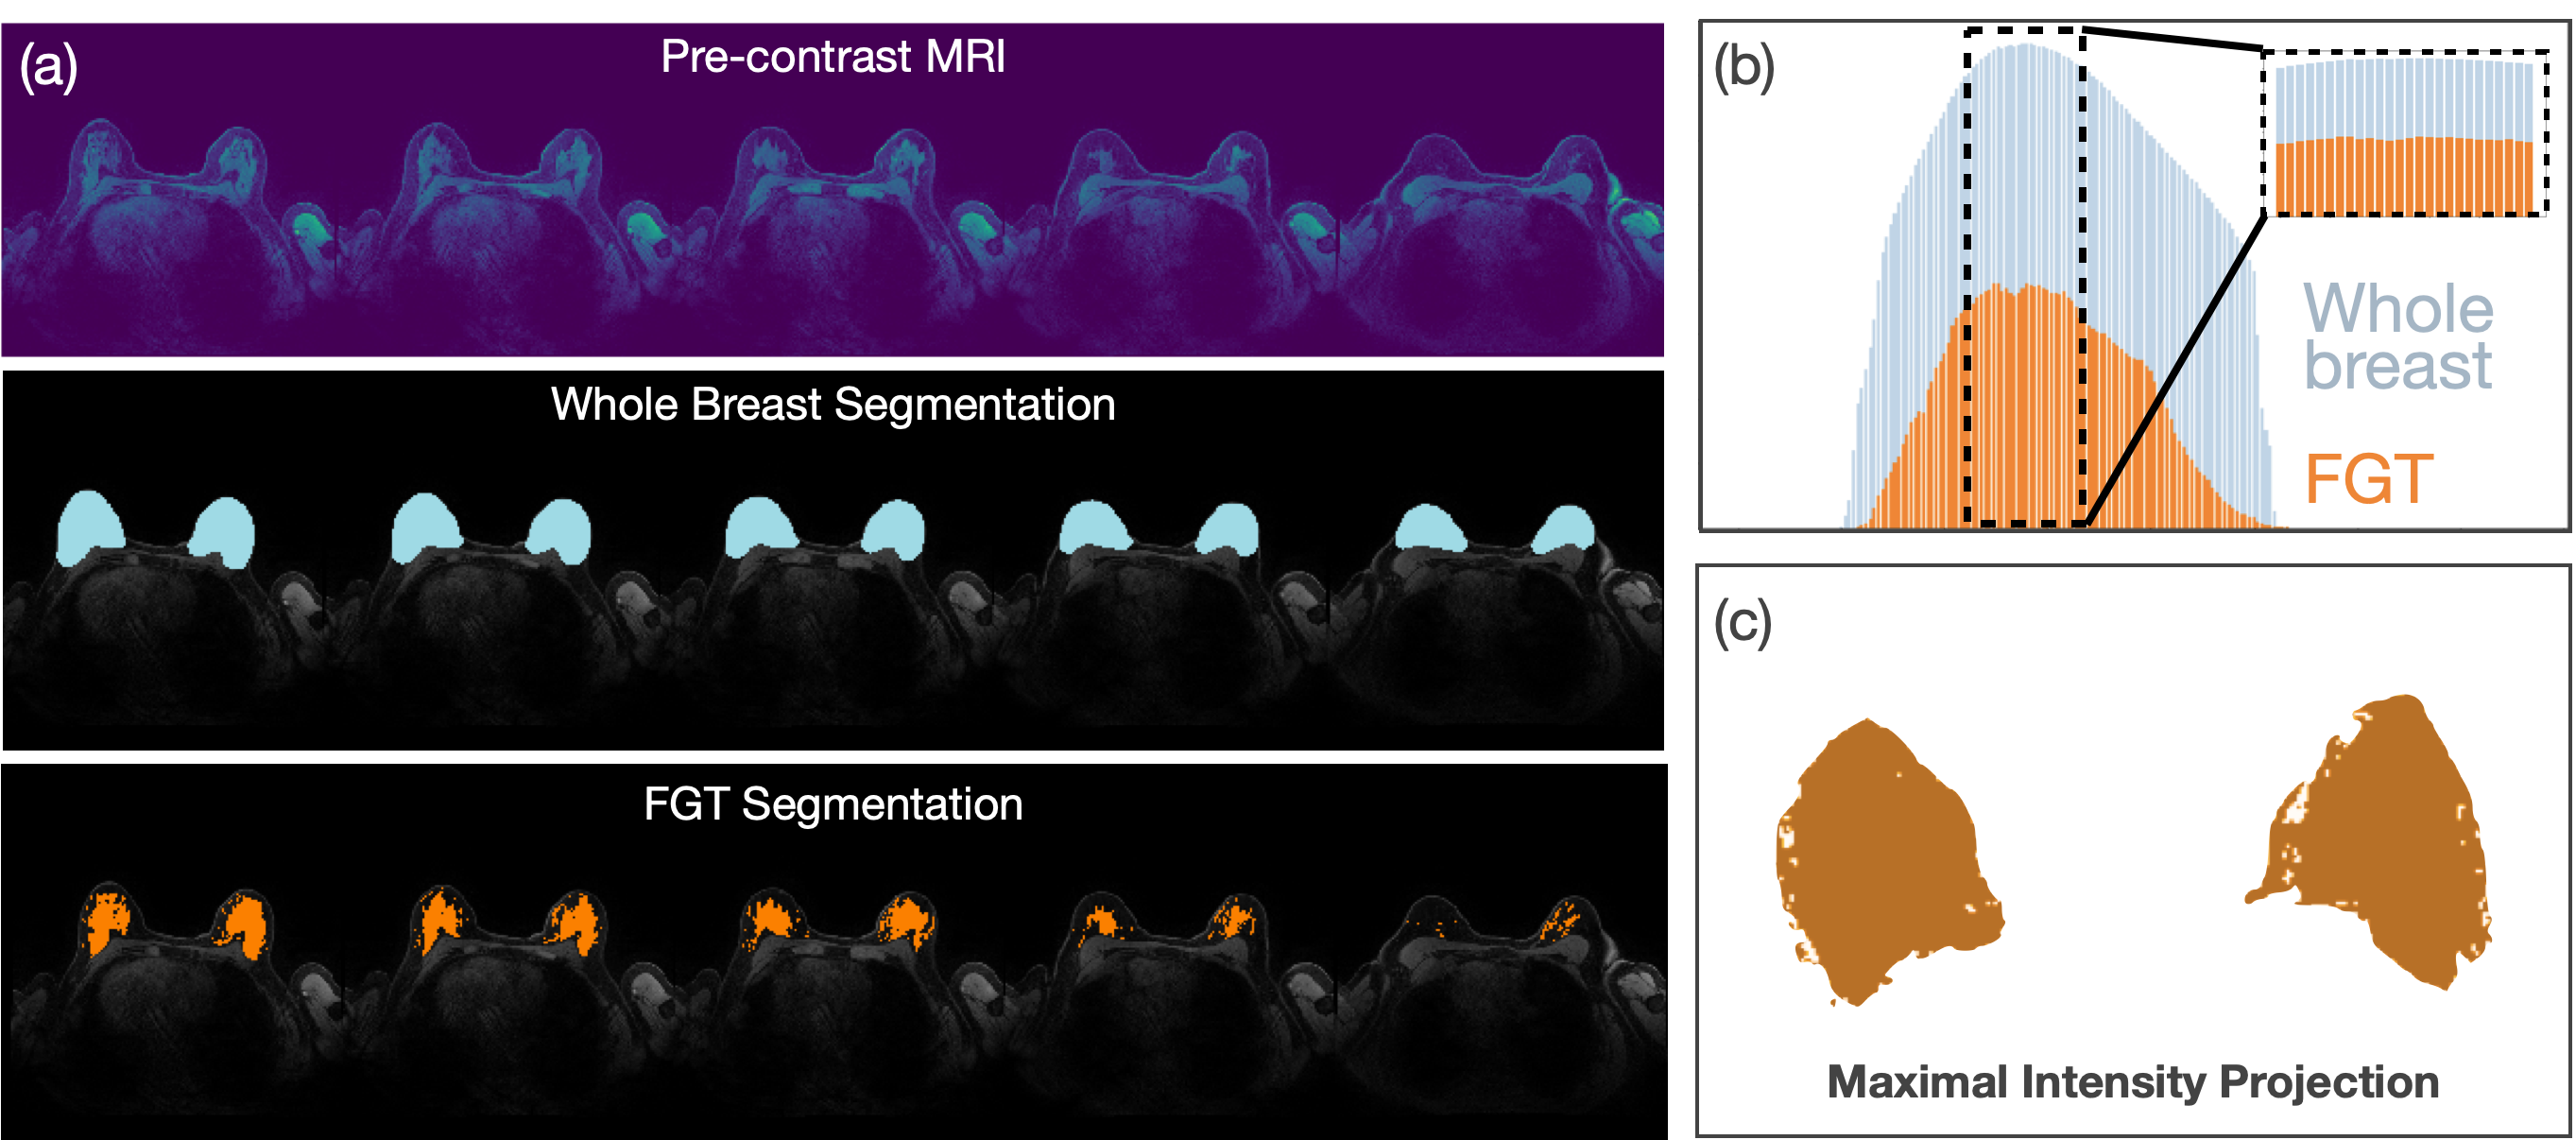
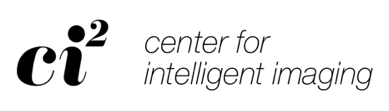
Fig. 1 Methods of FGT ratio calculation. (a) Example slices of pre-contrast image (top), whole breast (middle) and FGT segmentations (bottom) for one typical exam labelled ‘extreme fibroglandular tissue’ according to the radiology report. (b) Ratio of FGT (orange) to whole breast (blue) segmentations is higher for center slices (ρ=49%, inset) compared to all slices (ρ=36%). (c) Resulting FGT segmentation following the Maximal Intensity Projection method skews densities even more toward higher values (ρ=70%).
Fig. 2. Distribution of FGT amounts per radiology-defined class for different density calculation methods. (a) Simple density, where all slices were considered for the FGT amount calculation, (b) threshold-based density, where only slices with a significant amount of FGT are considered, and (c) maximal intensity projection, where segmentations across all slices were projected onto a 2-dimensional array prior to the density calculation.