1Institute of Medical Sciences, University of Aberdeen, Aberdeen, United Kingdom, 2Donders Institute for Brain, Cognition and Behaviour, Radboud University, Nijmegen, Netherlands, 3Breast Unit, Aberdeen Royal Infirmary, Aberdeen, United Kingdom, 4School of Medicine, University of Aberdeen, Aberdeen, United Kingdom, 5Pathology Department, Aberdeen Royal Infirmary, Aberdeen, United Kingdom
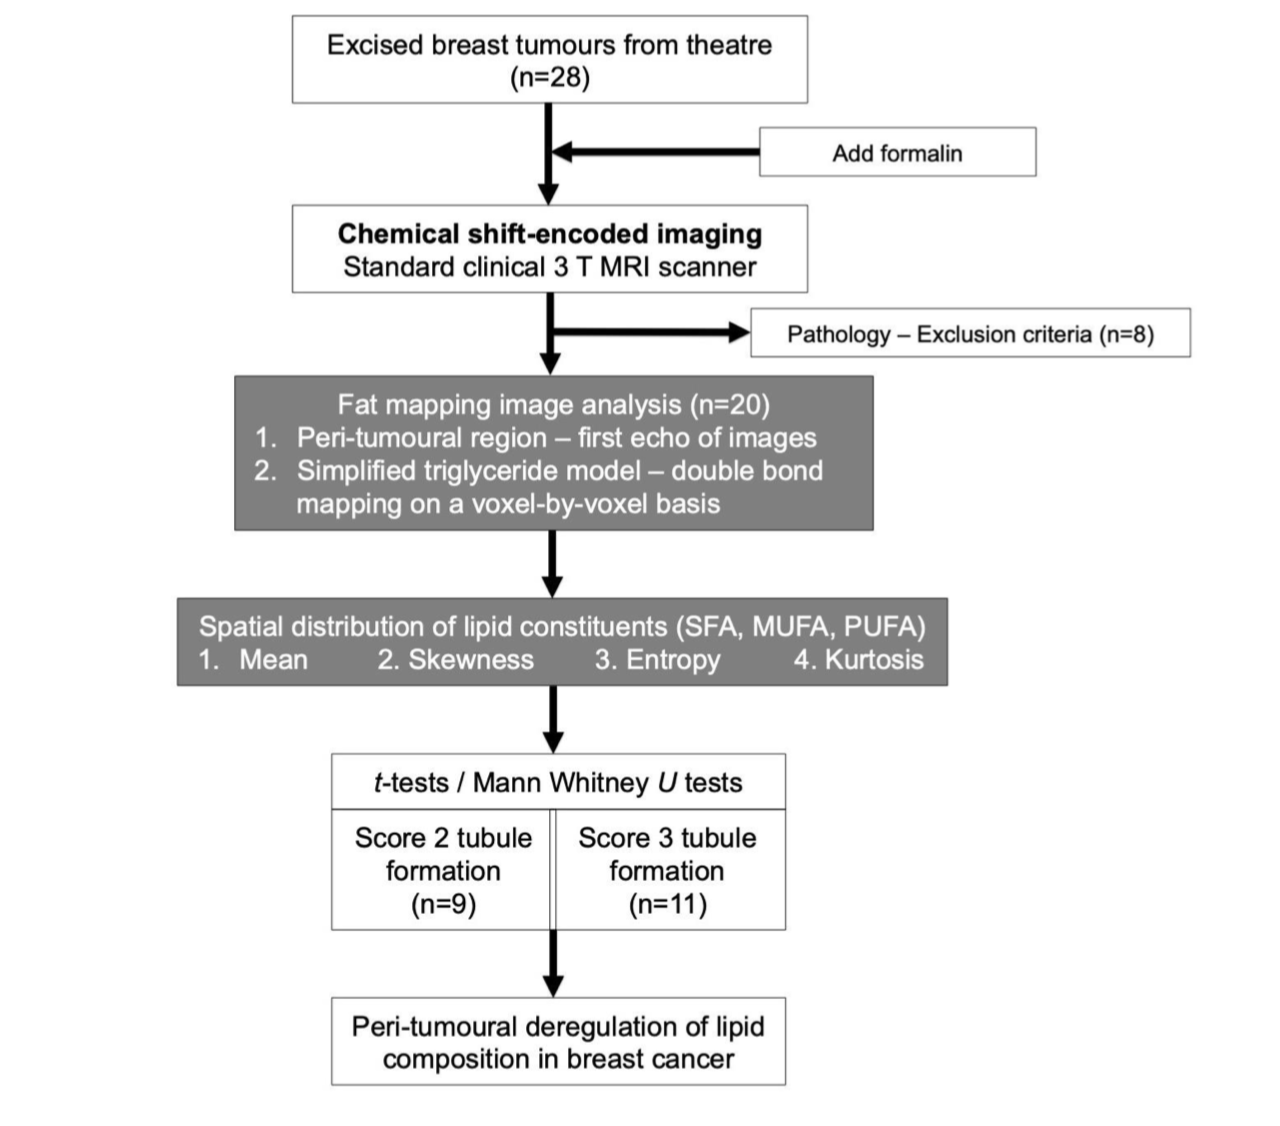
Figure 1. Study design.
A two-group cross-sectional study in a flow chart. Eight specimens were excluded due to small tumour size and mixed phenotype. Regions of interests (ROI) were drawn on chemical shift-encoded images (CSEI) to define the adipose tissue boundary. Fat, water and the number of double bonds in triglyceride molecules were estimated from the CSEI data, from which saturated, monounsaturated and polyunsaturated fatty acids (SFA, MUFA and PUFA) were derived. Statistical comparison was conducted on lipid components between Scores 2 and 3 tubule formation.
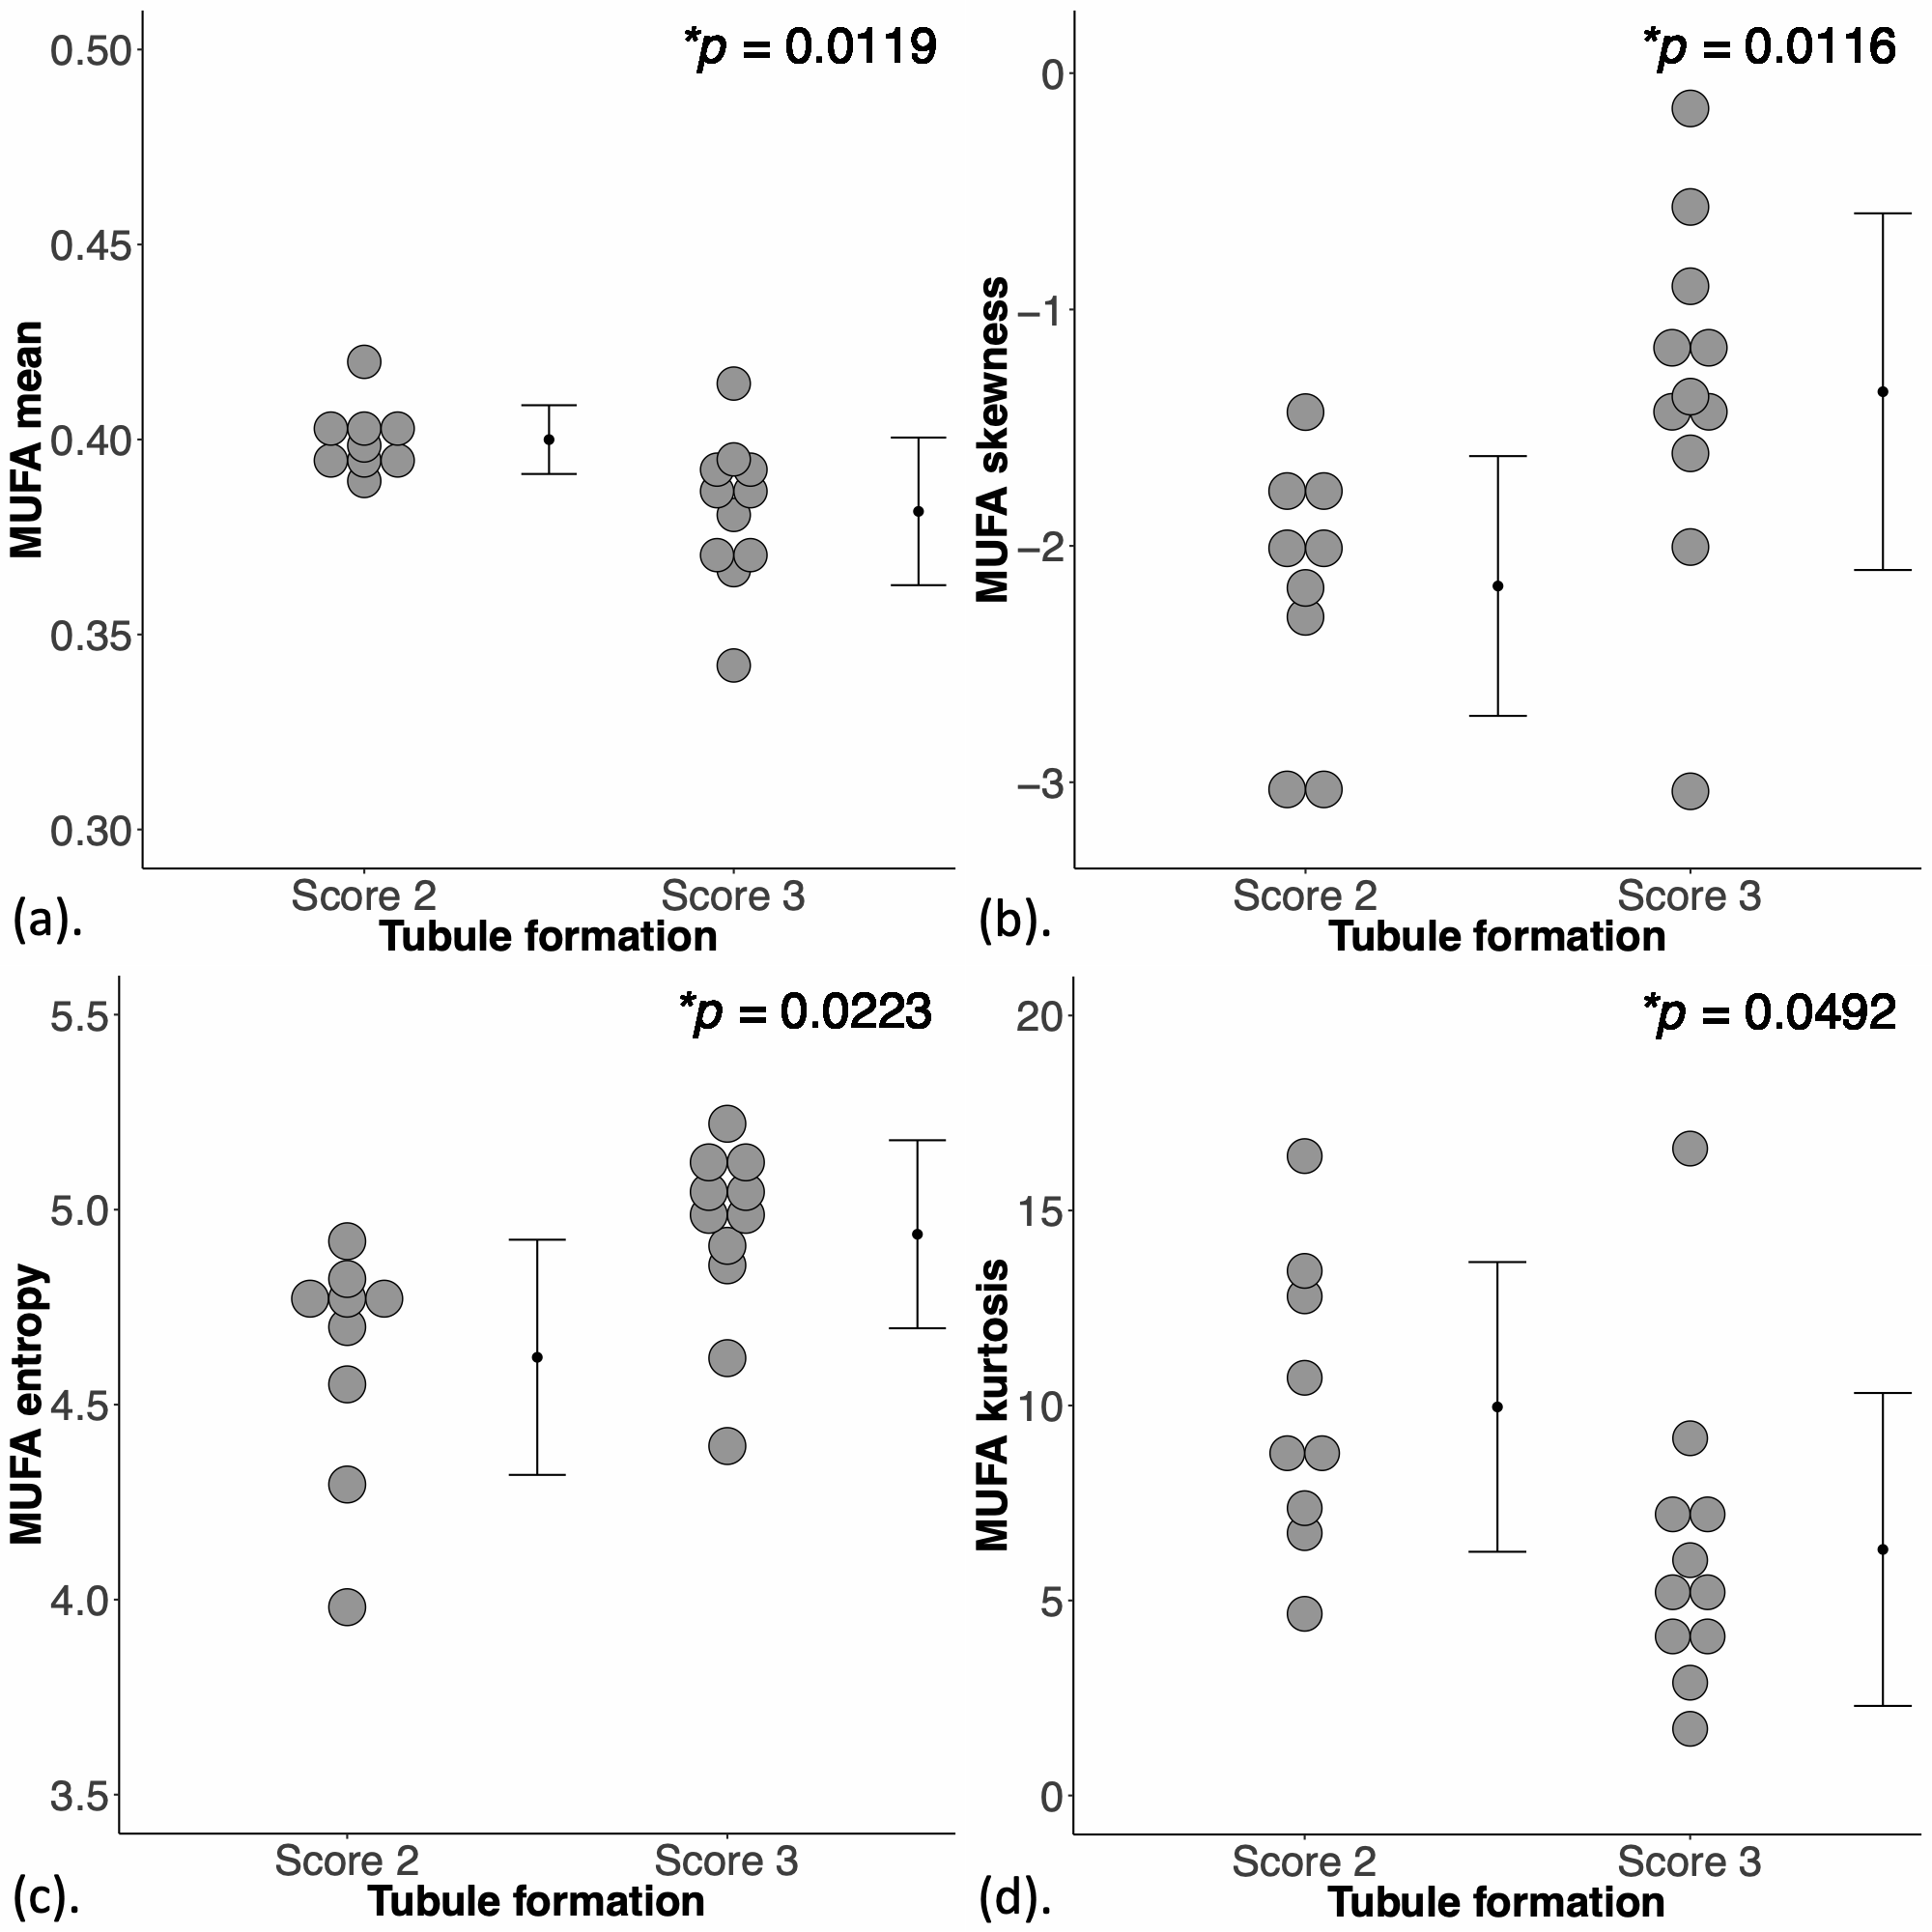
Figure 2. Group differences in peri-tumoural monounsaturated fatty acids (MUFA) in breast adipose tissue.
The difference in MUFA (a) mean, (b) skewness, (c) entropy and (d) kurtosis between breast cancer with Scores 2 and 3 tubule formation are shown in dot plots. Each dot represents the spatial distribution around the breast tumour, and the dots are organised in two columns corresponding to the two groups. The error bar indicates the mean and standard deviation. The t-tests were performed and p value is shown for each plot. Statistically significant p values (< 0.05) are marked by ‘*’.