Ping N Wang1, Julia V Velikina2, Leah C Henze Bancroft2, Alexey A Samsonov2, Frederick Felcz2, Roberta M Strigel1,2,3, and James H Holmes2
1Department of Medical Physics, University of Wisconsin-Madison, Madison, WI, United States, 2Department of Radiology, University of Wisconsin-Madison, Madison, WI, United States, 3Carbone Cancer Center, University of Wisconsin-Madison, Madison, WI, United States
1Department of Medical Physics, University of Wisconsin-Madison, Madison, WI, United States, 2Department of Radiology, University of Wisconsin-Madison, Madison, WI, United States, 3Carbone Cancer Center, University of Wisconsin-Madison, Madison, WI, United States
This work demonstrated that MOCCO can provide high temporal
fidelity including robustness to recover different temporal enhancement curves
for quantitative analysis in the setting of breast DCE-MRI.
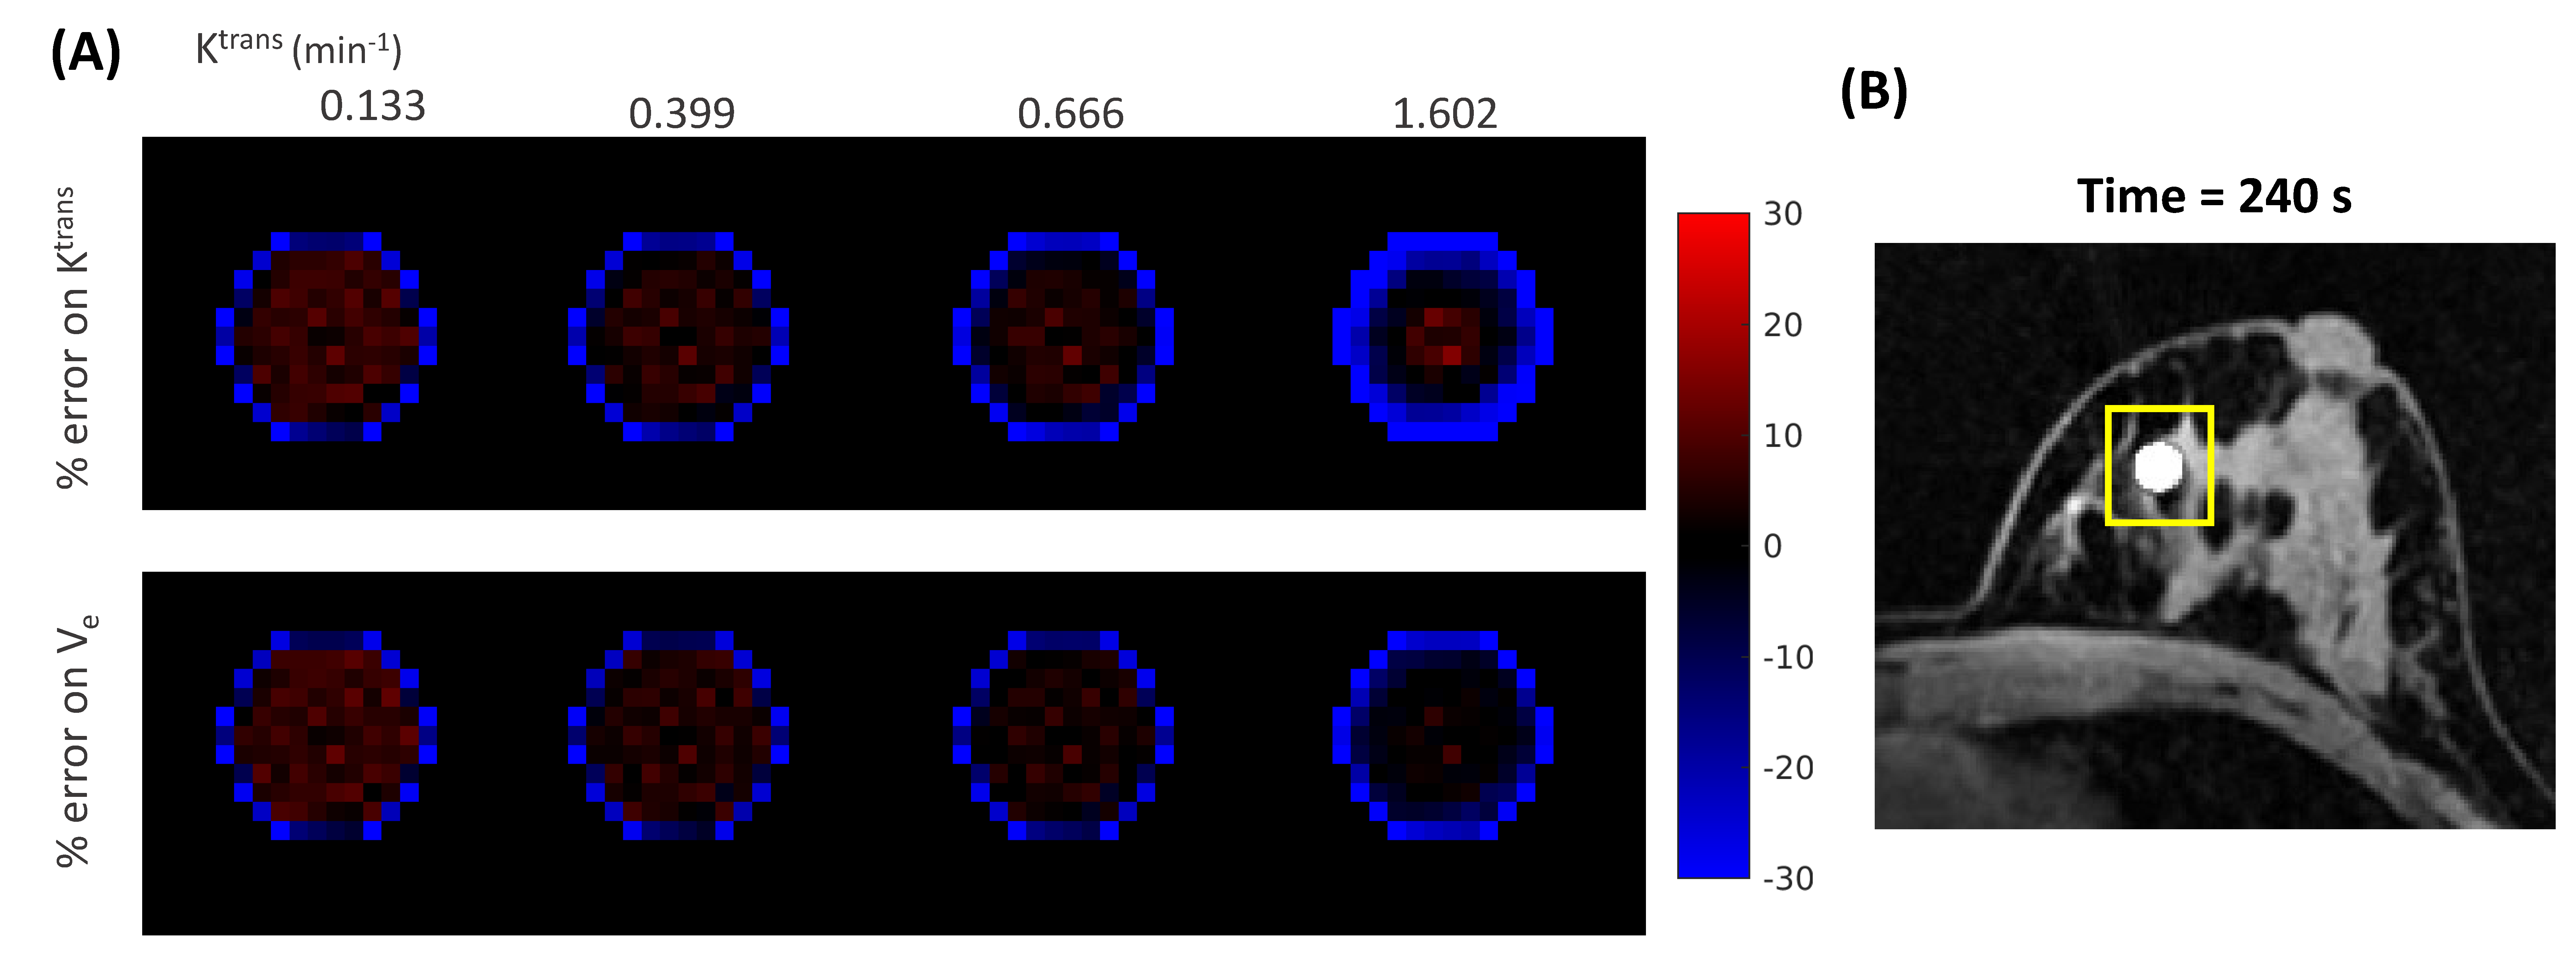
Figure 4. Visualization of error maps of (A) Ktrans
= 0.133, 0.399, 0.666, 1.602 min-1
and Ve = 0.3 obtained by measuring the % differences between
the fitted parameters and the true values (% error) for the lesion region depicted
in (B). Red and blue represent the level of overestimation and underestimation,
respectively.
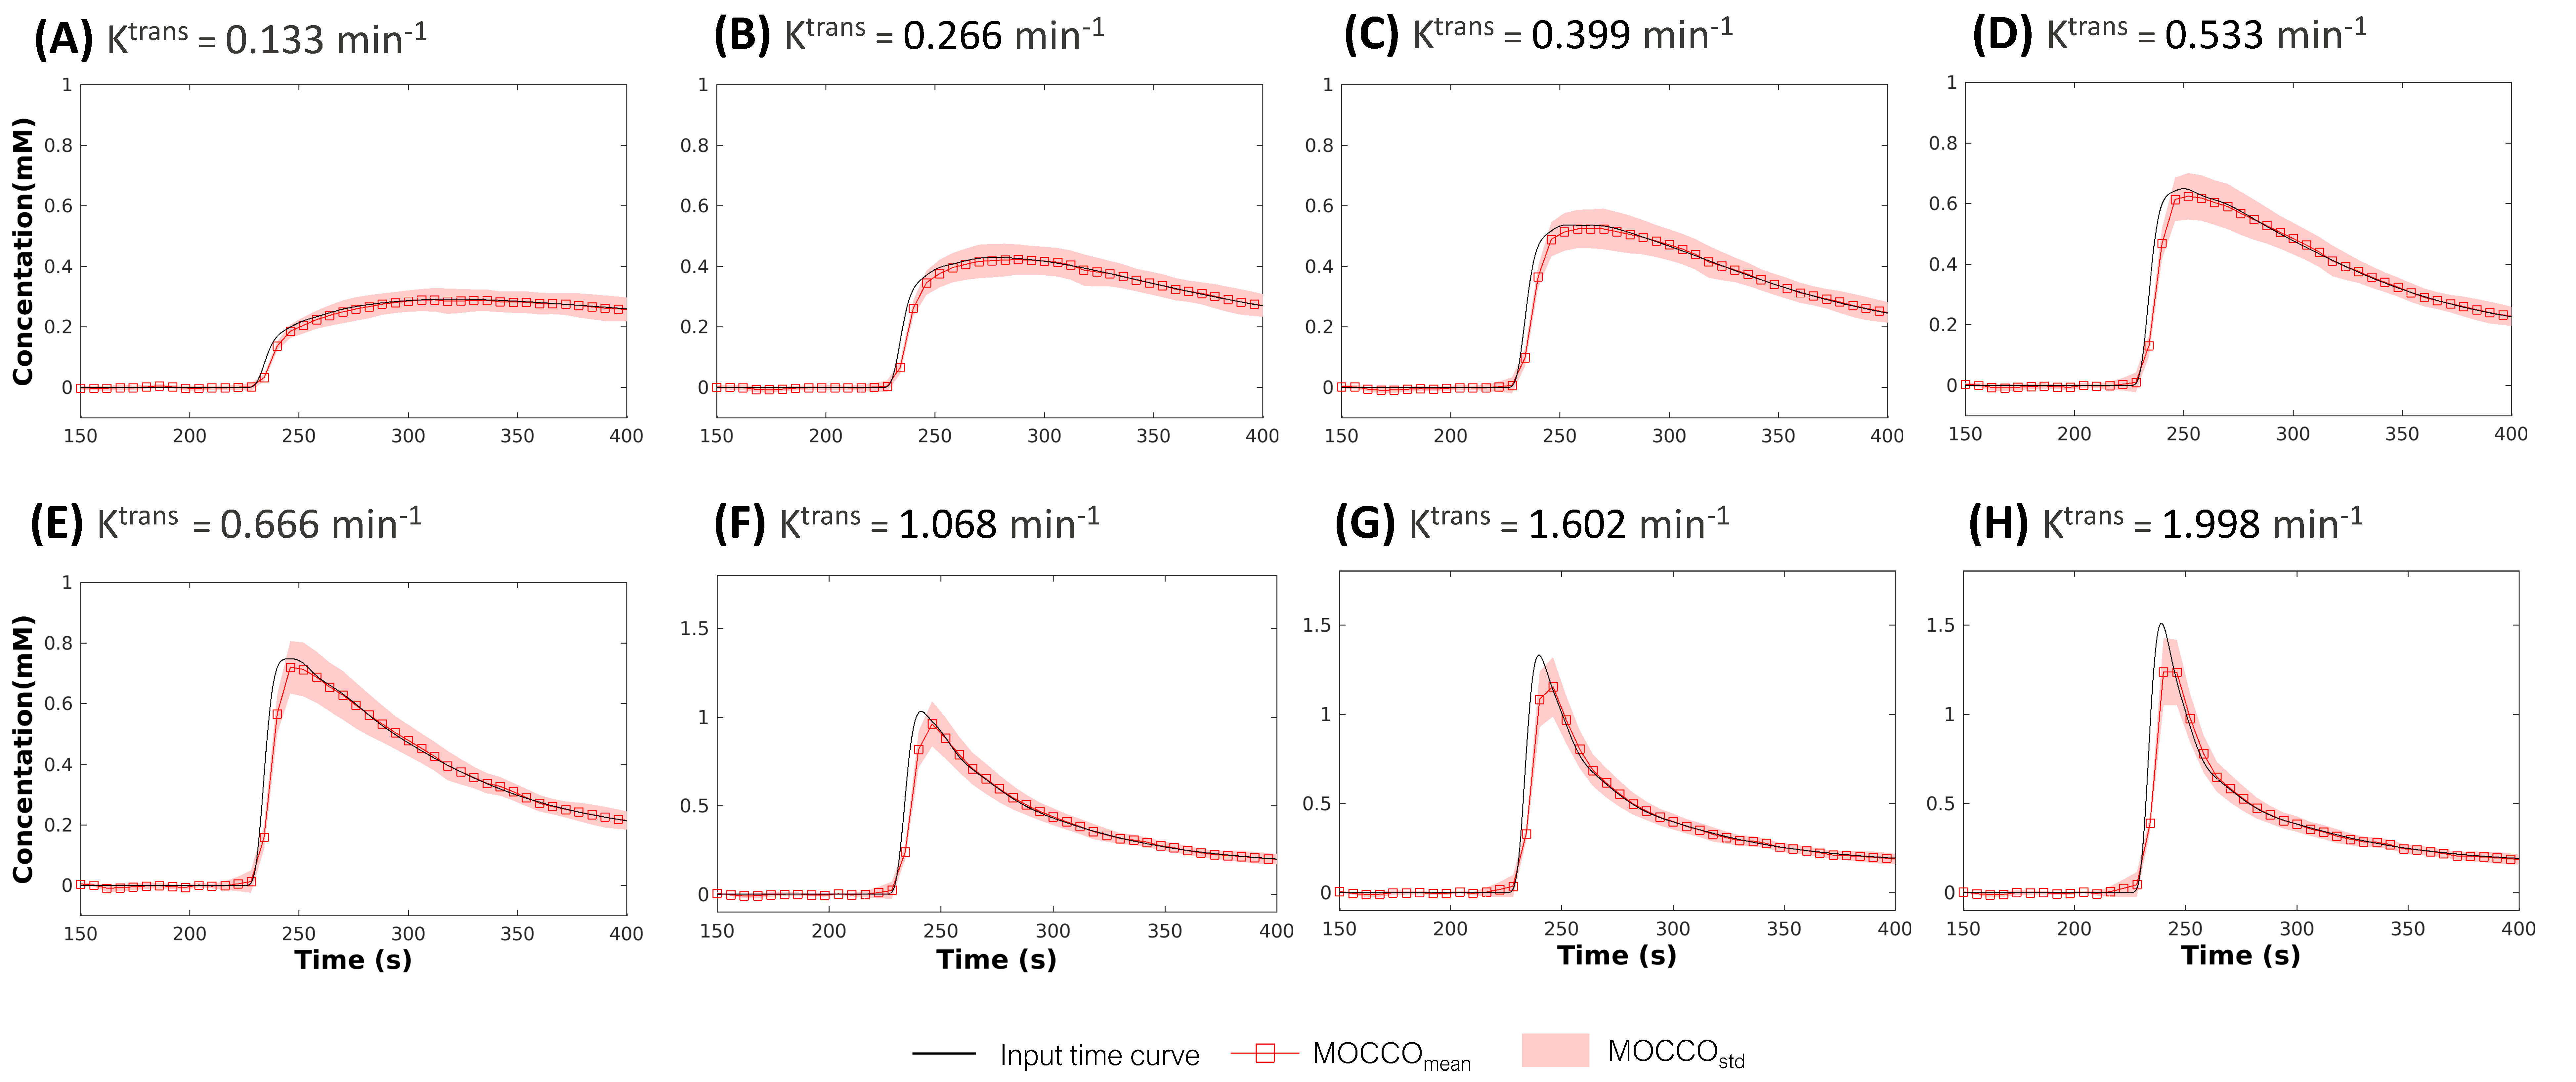
Figure 2: Simulated contrast agent concentration uptake
curves (displayed for a subset of time from 150 s to 400 s). Mean concentration
for eight lesions with varying pharmacokinetics reconstructed using MOCCO (A-H,
red squares). Standard deviations are shown with banded areas. The input time
curves (“truth”) used to generate the source data are plotted in black for all
frames.