Ayesha Bharadwaj Das1, James Andrew Tranos2, Jin Zhang1, Youssef Zaim Wadghiri2, and Gene Kim1
1Radiology, Weill Cornell Medicine, New York, NY, United States, 2Radiology, New York University School of Medicine, New York, NY, United States
1Radiology, Weill Cornell Medicine, New York, NY, United States, 2Radiology, New York University School of Medicine, New York, NY, United States
This study results suggest the feasibility of using the two-flip angle approach during DCE-MRI scan to estimate pre-contrast T1 without using an extra scan in order to perform T1 measurement, when assessed in terms of Gd concentration estimation.
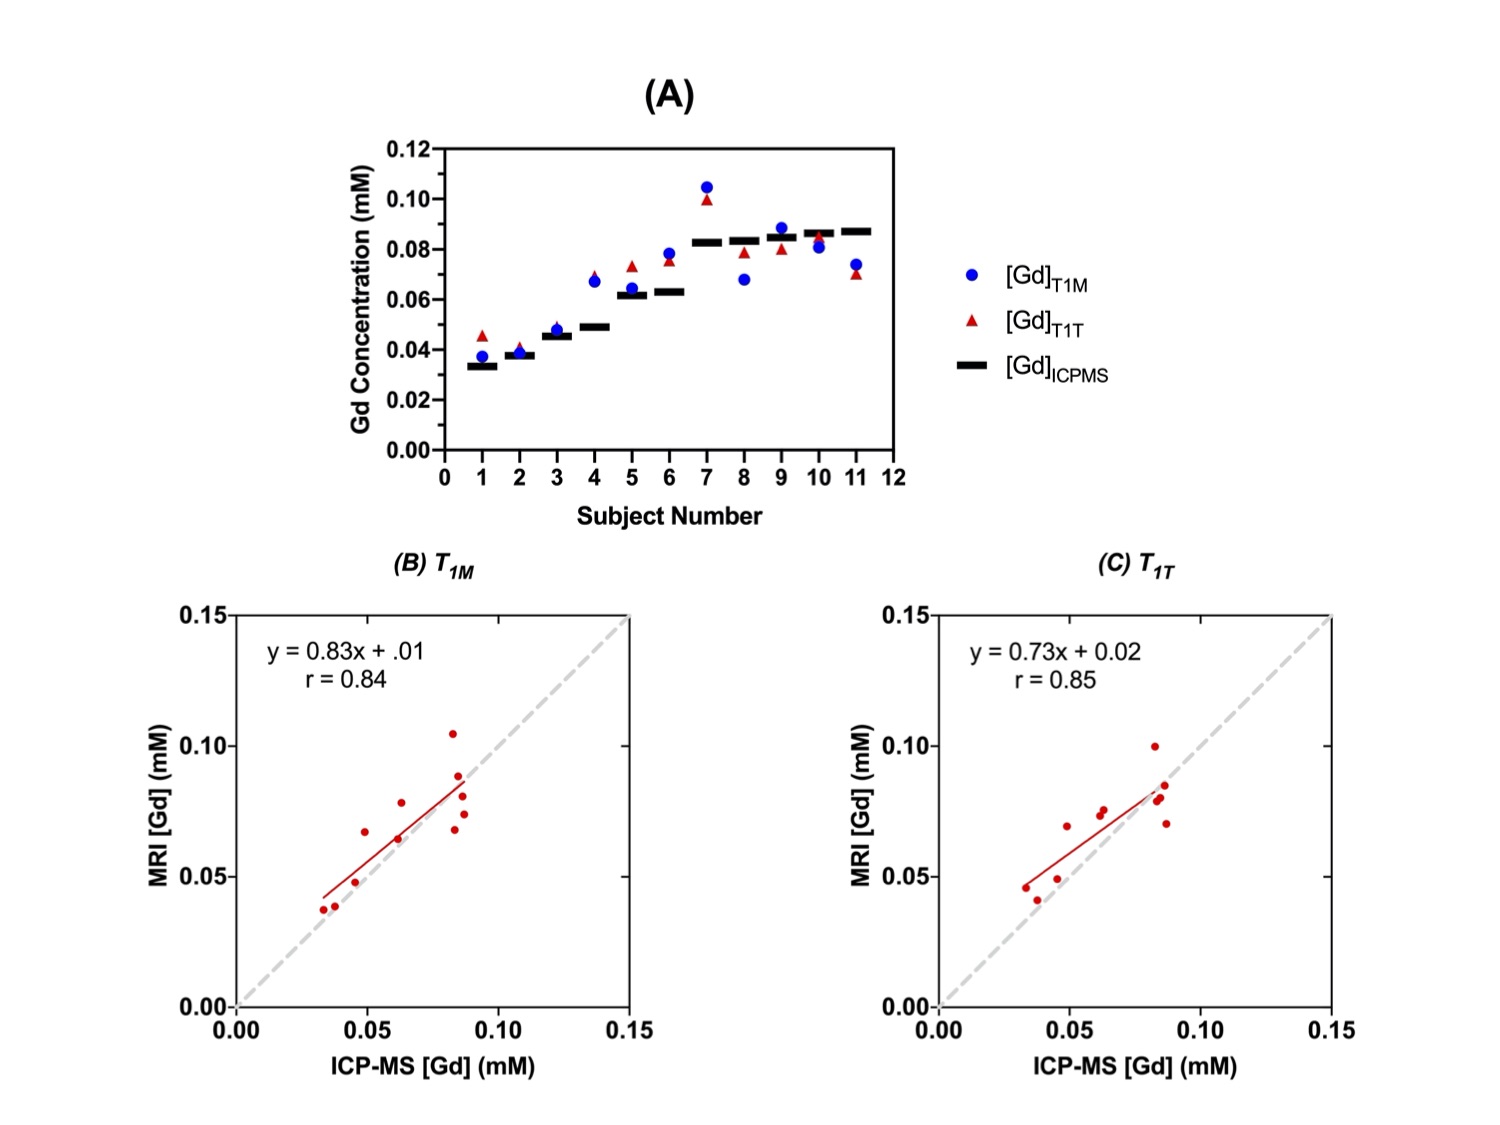
Figure 4. (A) Accuracy in image derived Gd estimation versus ICPMS measurement. The average error for T1M method was 14.3%. The average error for T1T method was 17%. (B) [Gd] from MRI measurement using T1M method and T1T method (C) vs. ICP-MS measured [Gd]. (B) has a correlation coefficient of 0.84. (C) has a correlation coefficient of 0.85. The gray dash lines are unity lines.
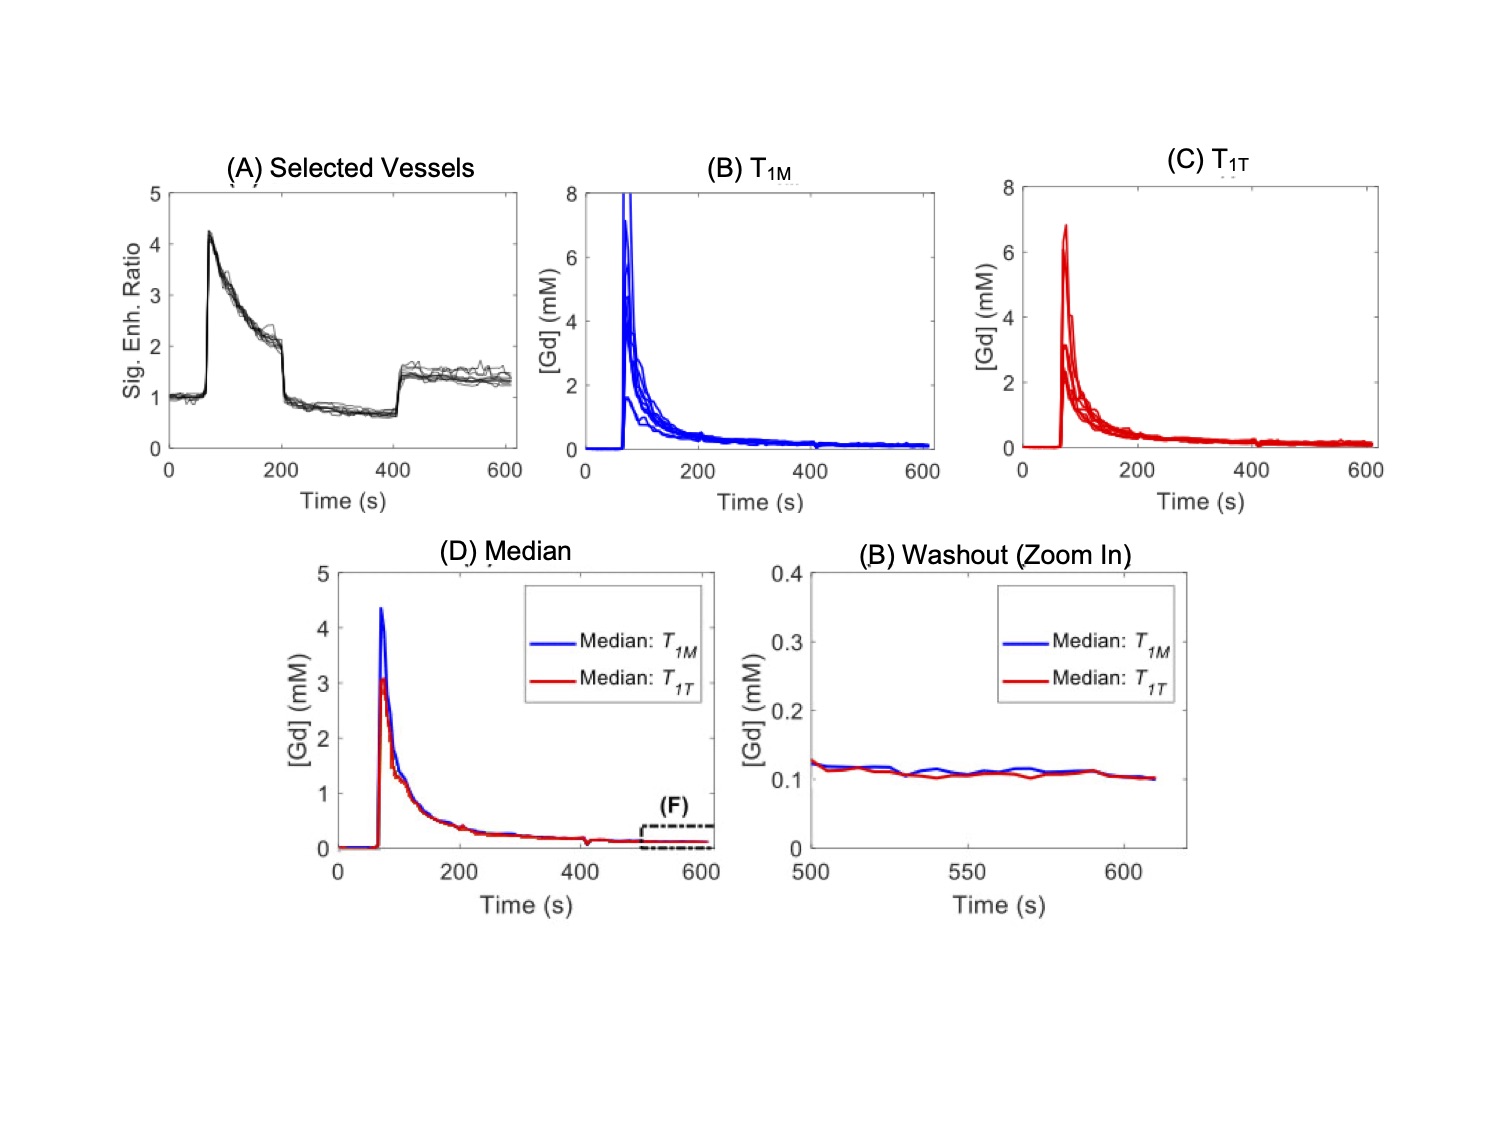
Figure 2. Example of signal intensity to [Gd] conversion using the top 10 most enhanced vessels from IAUC selection. (A) Normalized vessel signal enhancement curves. (B) Signal enhancement curves converted to [Gd] using T1M. (C) Signal enhancement curves converted to [Gd] from T1T. (D) All signal enhancement curves overlaid with a dashed box over the tail end. (E) A zoomed-in image for the tail end of the signal enhancement curves. The concentrations at last time point (610 s) were used to cross validation with ICP-MS method.